Data Driven Storytelling

My Media Project

Word Cloud that shows most common Baby Names in New York City in 2011. The names that were the most common show up the largest on the picture.

The Story

The story being depicted here is that is that popular boy names are more commonly used than popular girl names. There are many possibilities for the reason behind this; there are more variations in spellings for girl names, boys are more likely to be named after other family members, or because parents tend to be more creative and unique when it comes to naming their daughters. Whatever the reason may be, the data speaks for itself, boy names rank higher than girl names.

Type of Media

I used a Word Cloud to depict the popularity of certain names. This media shows words (or in this case, names) that are more common as bigger and words that are less common as smaller.

Process of Making the Media

To make this chart, I used excel to organize the and then I used wordart.com to turn the data into a chart.

Attributions

I got my data from Data.Gov
Connecticut School Rates Dropping?

I decided to do my project on school rates dropping in the state of Connecticut between one school year to the next. I saw there is an increase in students with disabilities and students experiencing homelessness. I can’t pinpoint if this is the actual reason there is a slight decrease in attendance. We would have to do more research including surveys to see why exactly this is. I decided on a video project because I could utilize visuals and audio to explain possible trends in my data. I got my data from Data.Gov to use in my video.

Equipment and visuals

All audio was recorded from my iPhone. I used videos from Pixabay which I attached below in a file link. Once I compiled all videos, charts, and photos I used ClipChamp to edit all information together. From there I added my audio that I recorded from my own phone and made little tweaks to get what we have today! I uploaded it to YouTube as I did before to another project.

Credits

Mayo Clinic article regarding Covid-19 timeline. CDC covid-19 vaccine information. I personally didn’t utilize any AI for this project however I can’t speak to any media I credited above.

Data-Driven Storytelling

Media Project

Story Summary and Data Links

My story is about the poor reading scores of American students. Although the data shows that scores have dropped since Covid, they show much more than that. The data also shows that more than half of American children have been reading below grade level since the assessments began, in 1992. As my story develops, I focus on why reading scores are so low, who it impacts the most, and what our leaders are finally doing about it. Data Link: https://www.nationsreportcard.gov/reading/nation/scores/?grade=4

My Chosen Media

I chose to use ArcGIS Storymap to tell my story. This felt like the best media to use because it allows me to share charts and graphics, alongside text to explain and expand the story effectively.

Making the Media

I used my MacBook to create the media. ArcGis allowed me to have a free public account. Although it does not give access to every feature, it was more than enough for this project. I’ve used ArcGIS Storymap before for other projects, and I was a little excited to use it again. I found instructions about how to embed it into WordPress, and fortunately it worked!

I used Excel to create a few of the charts, using data from The Nation’s Report Card. Some of the data that I wanted was not downloadable. In these cases, I used exciting charts and gave attribution to the author.

Attributions

I did not use any AI in this project. 

Photo by Thirdman, Pexels.com

Photo by   RDNE Stock project , Pexels.com

Photo by Pixabay, Pexels.com

Photo by  apmreports.org

Photo by  Arizona Department of Education 

Photo by lexialearning.com

Information from:

Senate.Gov

Lexia Learning

APM Reports

The Policy Circle

Finding Hope…

Audio Podcast & Video

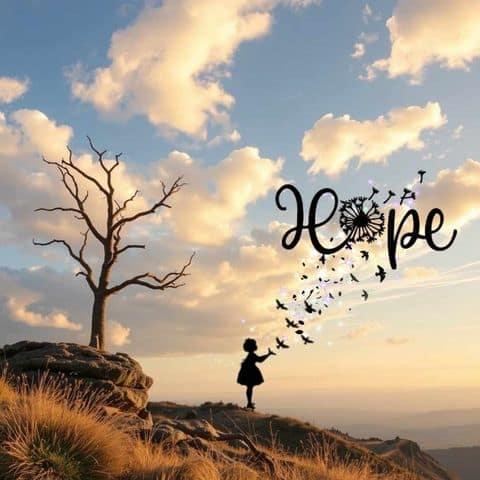
nature scene of a rocky peak with silhouette of girl releasing birds and sparkles that form the word HOPE
Created using picsart and unsplash stock photos by me, Kim Frisbee

Audio

Audio for my podcast was recorded using invideo.ai because I thought I’d be able to edit the file once the audio was finished from the same source and application. This proved difficult and I also couldn’t find where I’d saved the file on my computer and decided to just use Microsoft Clipchamp which was a lifesaver once I was able to locate the audio file on my laptop.


Kim’s Corner: On Hope

Attributes:

This video was made with Clipchamp

Pictures and stock videos from Clipchamp Content Library. I also included personal pictures that I’ve taken with my Samsung Galaxy phone as well as digital pictures that I created with PicsArt Studio for Android and Web. Audio was recorded through invideo.ai.

Transcript

Today I’m going to talk to you a little bit about HOPE and what that means to me personally and hopefully show you how it can help you through even the stormiest seasons of life.

So, what is hope anyway? Well, I think hope is a uniquely personal response to challenging times. For me, as a Catholic, I find my greatest hope comes in my personal trust that God will see me through these hard times because He has gotten me through some really dark times before. And it is that trust that keeps me holding to the hope that this too shall pass.

Some other ways to cultivate hope in your own life include:

Daily Gratitude Practice: Start or end your day by listing three things you’re grateful for. It might seem small, but it refocuses your mind on the positive.

Scripture Meditation: Reflect on hope-filled Bible verses. Pick one each week and meditate on its meaning.

Journaling: Write down your thoughts and prayers. It can help you process emotions and see progress over time.

Acts of Service: Helping others can shift your perspective and bring a sense of fulfillment.

Worship Music: Listen to uplifting songs that remind you of God’s promises.

Connect with a Mentor: Seek wisdom and encouragement from someone you trust within your church or community.

Hope is a unique, yet powerful ally for change. So embrace it, nurture it, and let it guide you on your journey and know that wherever that journey takes you, whatever challenges you face, there is always hope – and you are not alone.

Thank you for tuning in and may God bless you always. Until next time, this is Kim’s Corner. 

Data story

Media report

An infographic portraying the differences between the fall semesters of 2019 and 2020 at UMW.
Via Canva
A graph portraying the number of students for the fall semester of 2019.
Via Google Sheets
A graph portraying the total F percentage of each department for the fall semester of 2019.
Via Google Sheets
A graph portraying the number of students for the fall semester of 2020.
Via Google Sheets
A graph portraying the total F percentage of each department for the fall semester of 2020.
Via Google Sheets

Topic

You can find both data sets here. I used undergraduate fall 2019, and undergraduate fall 2020. I wanted to highlight the differences that COVID-19 had on the number of students and the total F percentage grade and compare the data between the two semesters. I found that fall of 2020 had almost three thousands less students compared to fall of 2019. I also found that the total F grade percentage from fall 2020 is almost three percent higher then the total of fall of 2019.

Media reflection

Instead of making a video or a podcast, I chose to make an infographic. For data sets, I felt this was the best option, as I didn’t know how to incorporate sounds or visual elements. An infographic was the best way for me to showcase my data trends.

Process

I chose to use Canva to make my infographic. I chose a premade infographic with an aesthetic I liked and customized it to fit my data report. I then used Google Sheets to make the graphs you see at the top of the post. I only used my computer to use this project.

Credit

For my pictures of graphs, I used Google Sheets to generate them. For my infographic, I used Canva. I did not use AI on this project.

Final Project

For my final project I am going to build out my main domain.

I am going to make it so that I can use it in job interviews or place it on my resume.

Final Project Proposal

Idea

For my final project, I was thinking of doing another podcast. I really enjoyed creating the first one and I feel as if I could create a successful series. I will create a subdomain on my site which will house the series. I plan to create a new series, as opposed to continuing my previous podcast. The new podcast series will be about the show ‘Gilmore Girls.’ I feel that I could easily create at least three episodes critiquing the show.

Final Project Idea

I would like to build out my main domain with projects I have worked on. I want to include projects from this DGST course, like the video and podcast projects. I also have podcast projects from my drug politics course that are much longer. Furthermore, I would also like to share some of the research papers I have written, particularly the ones from this semester’s politics of the Middle East and North Africa course regarding sports washing in Saudi Arabia and the Gulf nation’s responses to the Arab Spring. I envision the built out site retaining much of the same design that my current one has but with better organization for things like blog posts, podcasts, and research essays.

My Final Project!

It is so CRAZY that we’re already talking final projects??? How is it already time for this?

I Hate to Be Basic

So I hate to be basic, but I am definitely doing what Professor Berge said most people do for their final project…kinda.

I feel as though most of the hobbies and passions I have are SO unrelated to each other, so when I show and tell people about each of them and the work I do within their spheres, they’re all separate. SO, I want to create a subdomain where all of my creative works can live and coexist in one space together, organized respectively and packaged with a bow:)

This will include all of my experience in both of my career field interests, both historic preservation and communications, fitness and wellness accomplishments and clients, and any creative works including but not limited to content creation, photography, and modeling. To include all of these, there will be images, links, and blog posts included in this subdomain. This subdomain will be created keeping in mind that it will be a link on my resume, so all works will be included will be works I’d be okay with possible employers seeing (lol).

Wish me luck!

Final Project Proposal

I want to build a new subdomain fr my final project. I have two options:

  1. I would like to create a field hockey tutorial website, where I post videos of my teammates and me demonstrating field hockey skills to teach others.
  2. I would like to continue my Dancing with the Stars reaction videos to other dances, potentially other seasons.

I feel like option one is very interesting to me, but option two would provide more entertainment to anyone who wants to view. Either idea will be a new subdomain, and have the same format, just different videos will be filmed.

css.php