Final Project Report

Accessibility and Media/Source credit

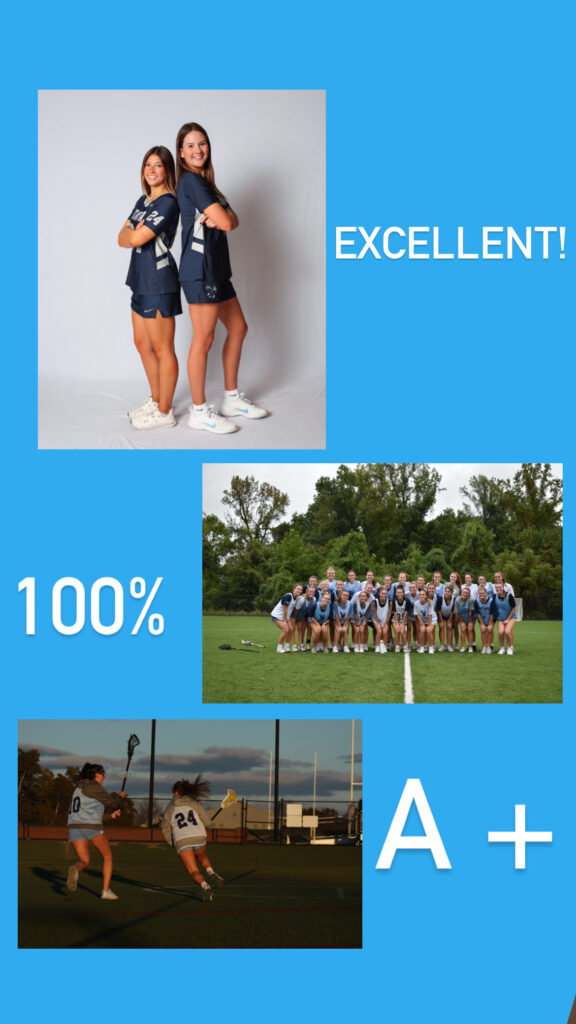
For my final project I followed all accessibility guidelines which includes Alt text for images, Heading structure for posts/pages, Descriptive link text for all links, High color contrast for images and text and an audio transcript for all podcasts. For my media and source credit I have listed it on all podcast post, here is the list of credits: For audio editing I used the website VEED.io . Photo credit: J-Slo Photo (UMW media day photographer). For audio transcript I used Descript.com.

Information Accuracy and copyright license

For this project I used all my own personal information. I used my own and other lacrosse players personal experience to create fun and entertaining podcasts. I used all copyright free sites to edit my audios. I also used not help from AI.

Link to Podcast website

https://sportsatumw.makennahadden24.com/

Final Project

Idea

For my final project I would like to continue with my Podcast. 

cartoon girl with blue hair who seems very stressed thinking the thoughts in the thought bubble are colorful but jumbled.

image created through Canva AI Dream-Lab

Image created through Canva AI Dream-Lab

Proposal

I would like to be able to re-do/re-configure my original podcast video.  I have the first podcast talking about homelessness and affordable housing.  I would like to continue on that same track and have my next one talk about homeless shelter “living”.  The final podcast I would like to have discussing the likelihood of shelter residents finding and being able to maintain housing and the challenges that come with it.  I would conduct interviews with shelter personal and their case manager to find my information. 

cartoon image of excited or happy woman interviewing 2 people and writing down their responses to her questions.

Image created through Canva AI – Dream Lab

Conclusion

I look forward to heraring your thoughts on my project proposal during our Zoom meeting on Monday.

this is an image of a cartoon male and a cartoon  female meeting over Zoom and discussing their ideas

Image created through Canva AI – Dream Lab

Data Driven Story telling

Image created by Makenna Hadden
Image by Makenna Hadden

Audio Recording

Data

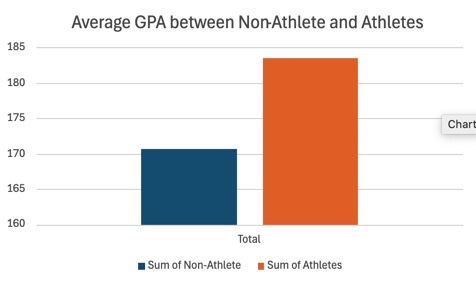
The data I used for this project was data comparing students who play sports in college verses students who don’t play sports grades. I got my data from StatCrunch. The data discussed how student athletes receive higher grades than students who don’t play sports.

Audio

I chose to create a short audio discussing this topic because I wanted to explain to listeners how the data was taken and what exactly it means. My audio supports my data because I discussed how students who play sports obtain a higher GPA, from a student-athlete perspective.

Equipment and Audio

I chose to use my computer audio recorder called “simple recorder” to record this project because it was simple and easy to use. To brainstorm the media I wanted in my audio I wrote down a checklist of what I needed to include.

Credit

StatCrunch

Makenna Hadden

Final Project Idea

For my final project, I want to expand on my Coni101 podcast about student involvement in school. The first episode will be reused from the podcast module where I talk about how student involvement can impact your academics in a good way. After that, I’ll do two more episodes where I interview people who are involved in extracurriculars. One episode will be about balancing school, extracurriculars, and personal time. The other episode will be about students’ lifestyles before vs after getting involved in extracurriculars.

Final Project Idea

For my final project I want continue to discuss sports at UMW. I want to create a podcast and potentially interview sports players here at UMW. I would like to use my first audio from the audio assignment and then continue on with two other podcasts.

Data Project Checkpoint

Data

The data Set I used was comparing students who play sports verses students who don’t play sports GPAs. I used StatCrunch for my data.

The process

I used the data I found online to create an excel work book. I am very familiar with excel because I have used it several times before. I used the data to create a Pivot Table and used that to create the graph bellow. Here is my Excel Data.

Data Graph

Video Project

Topic

The topic I chose for my video was sports at UMW. I used YouTube to find a copyright free short clip of a field hockey game. For support for this topic, I used the UMW athletics website and the website Community College Daily for reasons why sports are important. 

Credit for my Sources

Makenna Hadden  

Vecteezy. Com (copyright free source) 

YouTube

The Recording Process

I chose to use my phone to record my videos. I used snap chat to create my cover photo. I used an app called video up! To edit my video and put all the clips together. Finally, I chose to upload my video to YouTube, so it is accessible to all.  

Data-driven Storytelling

Information used

The information that I used was the information that we had to find last week for the project. The information that I found last week was the number of undergraduate students enrolled at UMW as of December 2023. I took the programs with the highest and lowest number of students enrolled. This information was obtained from the University of Mary Washington website.

chart with a black backtround and red bars showing each of the departments for course of study at the University of Mary Washington and the nubmer of students enrolled in each department.

Information presentation

I chose to do a short video. There are many occasions that when you are attempting to share data it can be BORING!! I know that I personally have had to sit through meetings or presentations that during that time all you could think is…this could have been an email. I chose an option that with images and “ear catching” background music would keep the attention of the viewer.

How it was made

Although I did not use video footage, I did use photographs, still images, and factual information sheet within the presentation to show the information I was trying to share. The video was made in Microsoft Clipchamp. I believe, for me at least, that is the easiest format to use to create and share your video creations.

Presentation

Credit for informatio used

Images of the University of Mary Washington

Student Enrollment

Course InformationSample Page

Data Driven Storytelling

My Media Project

Word Cloud that shows most common Baby Names in New York City in 2011. The names that were the most common show up the largest on the picture.

The Story

The story being depicted here is that is that popular boy names are more commonly used than popular girl names. There are many possibilities for the reason behind this; there are more variations in spellings for girl names, boys are more likely to be named after other family members, or because parents tend to be more creative and unique when it comes to naming their daughters. Whatever the reason may be, the data speaks for itself, boy names rank higher than girl names.

Type of Media

I used a Word Cloud to depict the popularity of certain names. This media shows words (or in this case, names) that are more common as bigger and words that are less common as smaller.

Process of Making the Media

To make this chart, I used excel to organize the and then I used wordart.com to turn the data into a chart.

Attributions

I got my data from Data.Gov

Final Project

For my final project I am going to build out my main domain.

I am going to make it so that I can use it in job interviews or place it on my resume.

css.php