Data Project Checkpoint

Virginia’s Reading Report Card, 4th Grade

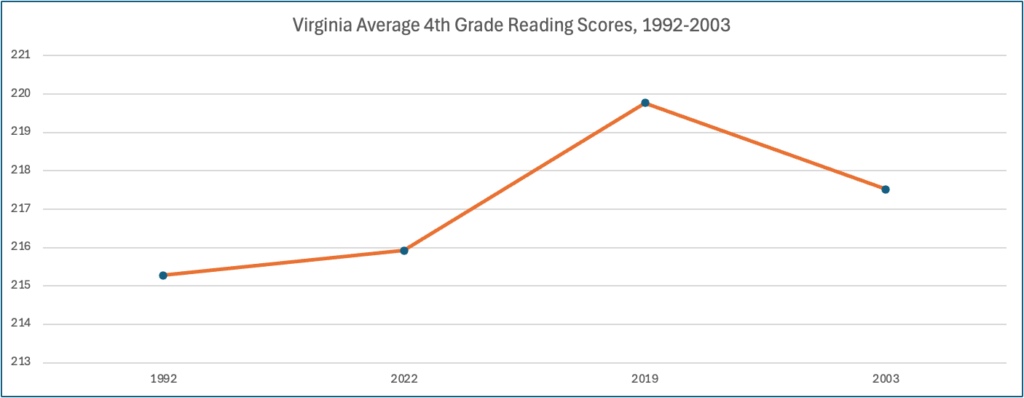
This is a line chart showing that the Virginia reading scores of 4th graders increased from 1992-2019, then decreased from 2019-2003
Chart showing Trend in Virginia Reading Scores. Data from The Nation’s Report Card

Trend

Overall, although the rate of 4th-grade children reading at the basic level was increasing from 1998 to 2019, it has declined from 2019 to 2022. The rate of 4th-grade children reading at the proficient level, which is 238, is significantly lower in 2022 than five years ago.

Process to Identify the Trend

I exported reading score data from The Nation’s Report Card into Excel. The data was collected at four different points in time between 1992 and 2002. It reports on the average score and the reading score percentiles of 4th graders from all 50 states, per collection year. I created a Pivot Table to show the average score per year for only Virginia. For 1992, some states did not collect data so I had to clean up this data before creating the Pivot Table. This is the data that I used to create my chart.

Data Link

The Nation’s Report Card

Spreadsheet and Table Link

The nations report card.xlsx

Data *Test*

Link to data file

This is a link to the data file via Google sheets.

Charts as image

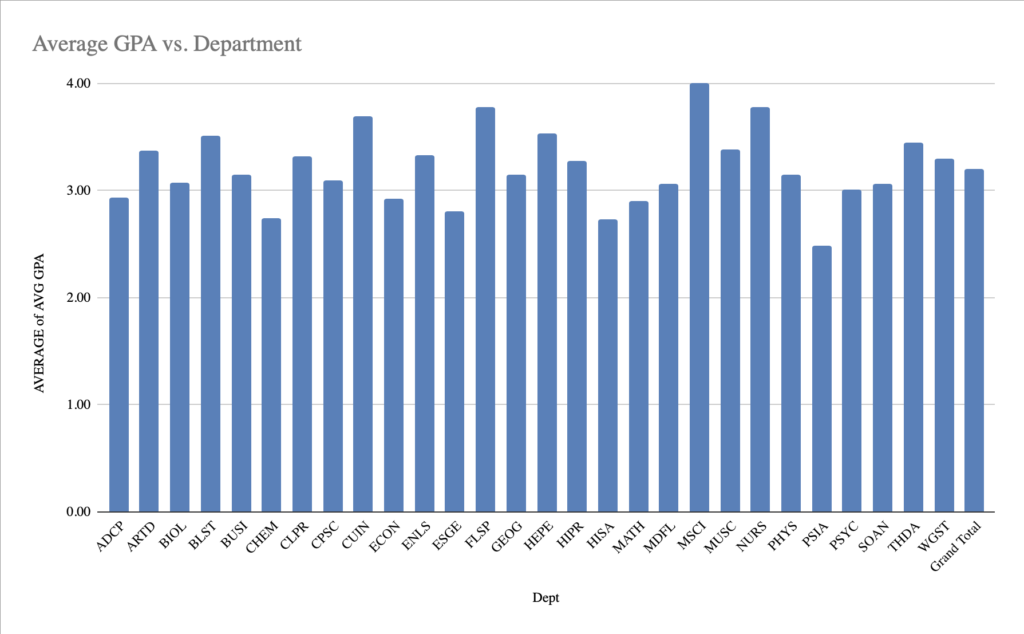
Chart of average GPA vs. department.

This is a chart of the average GPA’s per each department at UMW.

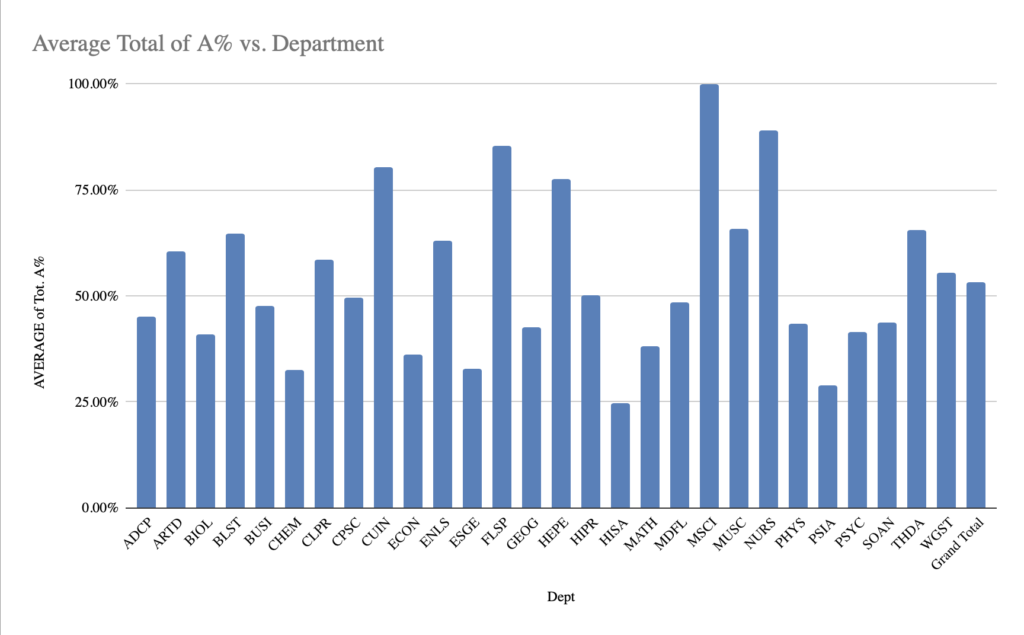
Charr of average total of A% vs. department.

This is a chart of the total of A% compared to each department. This is my trend analysis chart.

Link to dataset source

I found my data source from this website. I chose 2022-2023 grade distribution summary and focused on the undergraduate spring semester of 2023.

Trend explanation

For my trend analysis, I decided to analyze the average percent of A’s in each department. First, I found the average GPA’s in each department, and from there, I found the average percent of A’s. From these charts, I found that the lower the GPA for a class, the lower the A% average. For example, the PSIA department, or Political Science and International Affairs, had only a 2.5 average GPA. And only 26% of the students that semester received an A.

Process explanation

I used Google Sheets to help identify the trend. I put the data into the table and saw the averages for the GPA as well as the A% averages. I wanted to know the correlation between the two so I made separate tables. I was able to put both into pivot charts to easily identify the correlation. A’s in classes significantly help raise a GPA, so that’s why I chose those two different sections of the data.

Special K Chocolatey Delight

My favorite cereal! I had many different favorite cereals over the years: Raisin Bran, Krave, Fruity Pebbles. But in the end of my cereal eating era (there are only two I eat from time to time now), it was the Special K Chocolatey Delight that had me in a chokehold.

Have you walked into cereal aisles recently? There are like, a thousand options. That’s a lot of nutrition labels to read…

That’s why the data set I chose for this ‘Data Project’ is a cereal dataset!

My Cereal Data

Admittedly, this project was the bane of my existence and my headache the entire week. I don’t use Microsoft often, much less Excel, numbers are not my jam, and I simply didn’t (genuinely) have time to go to the DKC for help (which was part of my headache). I like making pretty things and looking at pretty things. Very different. I don’t like how my charts or tables look but I am so ready to stop looking at them. I digress, nothing is easy when you first do it, so a little struggle is healthy, but respectfully, I am so glad that this part is over:P

I got my cereal data from Kaggle btw!

Trend

So, I know we all had a moment in our upbringing when someone told us that cereal isn’t healthy and it was like this crazy realization so much so that we went into a rabbit hole of cereal nutrition labels (…no? Just me?), so instead of focusing on things like sugar and carbs which we all know cereals tend to have a quite a bit of, I wanted to see if there were any trends between any other parts of the nutrition labels. What I found (and chose to focus on) was that a strong positive correlation exists between fiber and potassium, indicating that cereals high in fiber are also likely to be high in potassium and cereals manufactured by Nabisco tend to have the highest average fiber content (therefore, they also have a higher average potassium content per serving)! Yay for no muscle cramps and regularity, if you know what I mean…

How?

How did I find this trend? Well, after I loaded the downloaded and loaded the data into Excel, I went through and deleted and columns and rows that I didn’t find relevant or didn’t want to analyze. I made a chart using the ‘Format as Chart’ button in Excel, and inserted a Pivot Table using that button. With the Pivot Table feature, you can make your own perfect storm of variables that you want to look at next to each other so that its easier to compare and well, analyze. I spent the most time doing this. I clicked around, adding and taking away different nutritional variables but always keeping the cereal name present. In the value field, I made sure I always had ‘average’ instead of ‘sum’ that way I was always looking at the averages of the numbers in front of me instead of what they added up to be. Everything I said is basically everything Professor Berge goes over in this video. Once I thought I saw a trend (the one I mentioned earlier), I asked ChatGPT how to calculate a correlation because I wanted to make sure I wasn’t just imagining it (lol) and these are the instructions it gave me:

  1. Click on an empty cell where you want to display the correlation value.

2. Enter the formula: =CORREL(range_fiber, range_potass), replacing range_fiber and range_potass with the actual cell ranges for the fiber and potassium columns, respectively (e.g., =CORREL(B2:B101, C2:C101)).

3. Press Enter to calculate the correlation. The result will indicate the strength of the relationship between fiber and potassium. A value close to 1 indicates a strong positive correlation.

…To which the value was 0.90! I was not, in fact, imagining it.

That’s when I decided to move some more values around and see which manufacturers cereals tend to have the highest fiber and potassium contents and I landed with Nabisco. I didn’t make a chart for that, however (Remember? Bane of my existence?).

Chart displaying the average fiber and potassium contents of several cereal brands sorted by manufacturer.

So, All-Bran with Extra Fiber does, in fact, beat the rest of cereals in fiber content. Period.

Thank you for coming to my…Blog talk?

Data Point Checkpoint

Data Set and Chart

My Data Set

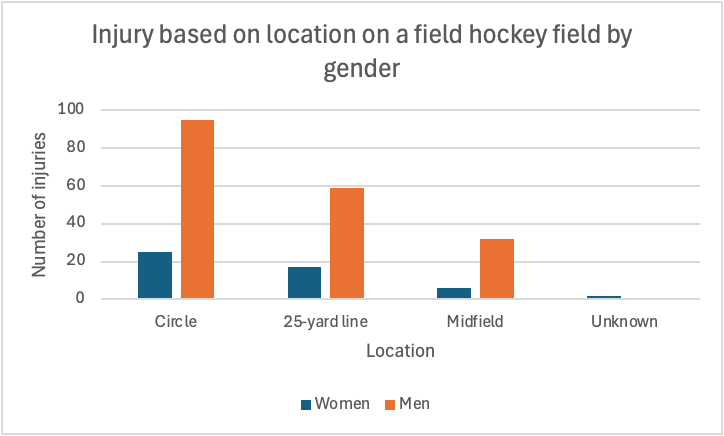
A bar graph that shows the relationship to how many injuries players face in relation to where on the field, displaying men and women

Link to my DataSet

Injury Data of Field Hockey Players

Trend

I noticed that as the players get further from the goal, the injuries decrease. The circle is the place on the field which is closest to the goal, which appears to have the most injuries with men and women. The mid field is the farthest location from the goal, as it appears that is where the least amount of injuries occur.

My Process

After finding the dataset, I copied it into excel. Then, I cleaned up the data, making it look better and more organized. After that, I created the Pivot Table, which displayed the data in a more clear way. Finally, I made a bar graph to visually show the data. These methods helped me determine the trends of the dataset.

Data Project Checkpoint

Spreadsheet

Chart

Screenshot of chart depicting tobacco use depending on race.

Overall Dataset

National Adult Tobacco Survey

Trend

The overall trend that is visible in this data set is that cigarette use is the most common form of tobacco use across all races. Also, it is evident that all forms of tobacco use are most common among white people.

Process

The process I used was pretty simple. I first downloaded the data set from data.gov as an Excel file. I then cleaned my data by removing empty datapoints and irrelevant information to the point I was trying to prove. I had some previous experience using Excel, so I didn’t struggle with the overall cleaning process, but watched the informational video from Canva to show exactly what should be kept/ removed. Trying to figure out the point I wanted to make was probably the most time consuming part of this project. The overall NATS shows race, education level, gender, etc. along with tobacco use, so there were many options for what I could’ve chosen. After finally deciding my point, I then went through each chart to decide which showed this relationship the clearest.

Data Trends in Obesity

Bar graph displaying the rate of obesity from highest percentage to lowest percentage.

Data as a storyteller

Multiple mediums can be used to tell a story, such as film or text. However, numbers can provide a quantifiable story in their own right. Datasets can be used to identify trends that emerge in various topics, that a more qualitative method if inquiry could ignore. One such case is that of the rate of obesity in the United States. While obesity is a national problem and the rate is ever increasing, one region in particular seems to be hit exceptionally hard by this health problem. The data shows that southern states rank especially high in regards to their obesity rate. In fact, nine out of the top ten most obese states are located in the southern United States. The only exception is Kansas, which is firmly outside the southern United States according to the geography of Britannica. From looking at the data the other regions of the United States seem to be more varied in their obesity rates depending on the individual state. No other single region is as heavily represented as the Deep South. This implies that there is something within the socioeconomic or cultural factors in the southern states that leads to a higher rate of obesity than in other regions of the country.

Methodology

The data on obesity rates intrigued me as exercising and fitness are hobbies of mine, and I was able to source the relevant data from the local government of Lake County, Illinois via Data.GOV. I used Microsoft Excel in order to build the data out into a pivot chart, fortunately the data was looking at the obesity rate from a state level and there was not a lot that needed to be cleaned up for the purposes of this examination. I sorted the data by the sum of obesity in a descending order. I then noticed that many of the highest rates were in the southern United States. The chart posted above, helps to show the severity of the Deep South’s obesity rate by illustrating the rate being well over 30% in some of those states. Excel made it easy to load a dataset into a table and then turn said table into a chart.

Excel Spreadsheet:

Coffee Break Podcast

Picture of a coffee mug sitting on a table with a spoon next to it.
Creator unknown. Image found on Pixabay.com

Podcast

Process

I used the voice memo app on my iPhone to record this episode. I then uploaded it into Soundtrap to edit and added music from the site. I used AI to help make an outline and script but then changed it to how I wanted the podcast to go. It gave me a good starting point, but I ended up taking out the parts that I didn’t think were necessary and added points I wanted to make.

Attributions

Click here to read more about making the perfect latte at home!

Here are the 10 best espresso machines to buy!

Music is from Soundtrap.com. Creator unknown.

Transcript

“Welcome back to Coffee Break! Today, we’re diving into the art of making a perfect latte right in your own kitchen. By the end of this episode, you’ll know all the steps to brew a delicious latte that rivals your favorite café. Let’s get started! First, let’s gather our ingredients. You’ll need: 1 or 2 shots of Freshly brewed espresso— depending on how strong you want your coffee. Milk—choose from whichever alternative you prefer, but I use whole milk. If you want your latte flavored, you’ll need flavored sweeteners or syrups. But this is optional. Now, for equipment, make sure you have: An espresso machine, A milk frother or steam wand if you want a hot latte, And, of course, a coffee cup to enjoy your creation! Let’s start by brewing our espresso. Either use ground coffee or simply grind your fresh coffee beans and pack them into the portafilter. Then, brew 1 to 2 shots depending on your preference. Next up is frothing the milk. This step is only if you want a hot latte, if you prefer iced- then skip this step and just use cold milk! If you’re using a steam wand, submerge it just below the surface of the milk and turn it on. Aim for a temperature around 150°F for that creamy texture. If you’re using a frother, heat the milk gently before frothing. Now it’s time to combine! Pour your frothed milk over the brewed espresso slowly. For those feeling adventurous, try your hand at some latte art—just tilt your cup and pour in a circular motion! If you like a little sweetness or flavor, now’s the time to add your favorite syrups or sweeteners. Vanilla or caramel are great, classic choices! To recap: brew your espresso, froth your milk, combine them beautifully, and add flavor if you wish! Don’t be afraid to experiment with different milk types and flavors to find your perfect blend. I’d love to hear how your lattes turn out—feel free to send in your feedback or questions! And don’t miss our next episode where we’ll explore coffee brewing methods from around the world. Remember to subscribe and follow us on social media for more coffee tips! Thanks for listening! Enjoy your latte!”

My YouTube Video??

Yuppp. You heard that right. What does Professor Berge have us up to now? Read more below.

We’re All Gonna Die One Day

That title look familiar? It should. It was the title of one of my recent blog posts where I told you what my audio and video project would be about, but if you don’t remember: “We’re All Gonna Die One Day” drives home a powerful message: we only have one life to live, so why let fears or insecurities hold us back? In the video, I challenge common gym-related fears, like not knowing how to use equipment or being afraid of looking foolish. I share how fitness transformed my life, and even though I didn’t personally struggle with gym intimidation, I relate to the urgency for change when health or happiness is at stake. The title underscores the idea that life’s brevity means we should prioritize our well-being, embrace failure, and take action now—no excuses.

The style was inspired by many of the motivational speeches and podcasts I listen to. Perhaps you’ve heard of Eric Thomas?

The Process

I’m not going to lie, walking into the gym with my long shot list had me a bit overwhelmed, especially because I normally just record willy nilly, but I got it done! I shot with my iPhone 14 Pro, most of the time in cinematic mode. In addition, I used my favorite tripod from Amazon. There were quite a few shots at the end that my boyfriend, Jordan, shot; I really like how those turned out.

I used the same audio from my audio project last week and only edited a few spots. To edit my video, I used CapCut pro, exporting at 1080P and 30spf.

I chose YouTube incase I ever explore YouTube in the future, plus I wanted to see how simple/hard it was to upload a video.

I used all of these pieces of equipment because I know them well. I was confident in my ability to produce a project I was proud of with the time I had since I use these tools often. Plus, I am happy with their quality!

Attribution

Phone alarm snooze and stressed man: Photos by cottonbro studio

Fail wood tiles: Photo by Markus Winkler

Partner battle ropes: Photo by Leon Ardho

Gym machines: Photo by TUBARONES PHOTOGRAPHY

Mistakes are proof you are trying: Photo by RDNE Stock project

Stop making excuses tiles: Photo by Brett Jordan

If you just say yes to yourself graphic: Me! Made on Canva

Here it is!

I hope you enjoy!

Love Yourz,

Kai:)

Heavy Is the Hand That Holds the Spoon: A Video Experience

Video

Video Transcript

My is Meaghan Van Dyke and I’m the host of Heavy is the Hand That Holds the Spoon, a look into the Mary Washington college dining experience. Welcome to our first and only episode.

For many students, college is their first experience of true Independence and the first time that they are relied upon to make meals for themselves. The question remains, how did students actually use the kitchens that are given to them in their University accommodations? To find out, we interviewed Eagle Landing residents and sophomore University of Washington, Riley Munford

I’m here with Mary Washington sophomore Riley Munford, who is a first-time apartment resident. Riley, would you mind telling me a little bit about what you like to cook in the apartment and where did you learn to cook that?

“Tonight for my friends, I am making a recipe that my aunt actually got in Europe when she was traveling abroad, and I think my family took took it and adapted it to an American sense of the meal. But I learned to cook it like growing up in my house with my mom, and we have this whole process of like all of these specific steps that we have to take. I’ve always had people tell me that there’s a more efficient way to do it but there’s like just a tradition of the specific, like way to make it that makes it homey.” “Yes!”

For University officials, understanding students eating habits is an important way to make sure that all students are accounted for and cared for. This has been Meaghan Van Dyke and this is been the first and only episode of Heavy is the Hand That Holds the Spoon, a look the Mary Washington dining experience.

Behind the Scenes

About

This video follows the experience of learning to cook in a college environment. In the podcast specifically, I interview my friend Riley, a sophomore at UMW and a first time apartment resident. While Riley talks about her experience cooking a very yummy tomato basil pasta meal, the video features me trying my best to recreate the meal under Riley’s instruction. To learn more about helpful cooking tips for beginners, visit this Kroger page on ways to improve your cooking methods. For a recipe specifically similar to Riley’s tomato pasta recipe, check out this tomato and garlic pasta recipe!

Editing and Recording

To record this video, I rented a tripod from the HCC and used the camera on my phone. The tripod with my phone proved to be the most efficient recording method with the best quality. I chose Canva for my video editing software, as I could both easily create my video’s logo through Canva and arrange and crop the videos faster. Finally, YouTube allowed me to edit my captions and control how I shared my video more clearly, prompting me to chose the streaming service for my project.

Attributions

While I recorded the videos myself, the graphic I created for the video’s logo was developed using the “Modern Minimalist Skincare Blog” template on Canva. A special thank you goes out to my roommates for helping me set up and eat the meal I prepared in this video, and for Riley for allowing me to interview her/film her welcoming me into the apartment 🙂

Project 8 Video

The Title and Script

I used the same title and script about resolving family conflict. I got the shots using my phone camera with voice recorder. I modified the script to match the shots.

Video Lists

As I indicated in project 8.6, It is difficult to get real family in conflict to record, so I made a video shot and added modified video clips to help convey the message. Attached is the lists.

Recording

I have to use phone camera because I don’t have actual digital camera and the tripod. I am not in Virginia so I was not able to use the equipment at the Convergence Center. I used my phone camera to take the shots and I used Canva to edit the graphic, the video clips and the shots. Attached is the video shots with the clips and the graphics.

CC BY 4.0. YouTube Video by Alberta Koomson

Visual Materials

I modified graphics and videos form Canva and took video shots with the phone camera.

Video Topic

The topic of the video is about how family members can resolve conflict.

Family conflict is normal it’s the repair that matters. For more information, click on the link: (Diana Divecha. Family Conflict Is Normal; It’s the Repair That Matters).

The video also goes over dealing with difficult family relationships. Click the link for information: Sheldon Reid. Dealing with Difficult Family Relationships)

css.php