
Data-Driven Storytelling
My Infographic
The final infographic for project 9
What is My Story?
Identifying the story represented within my infographic
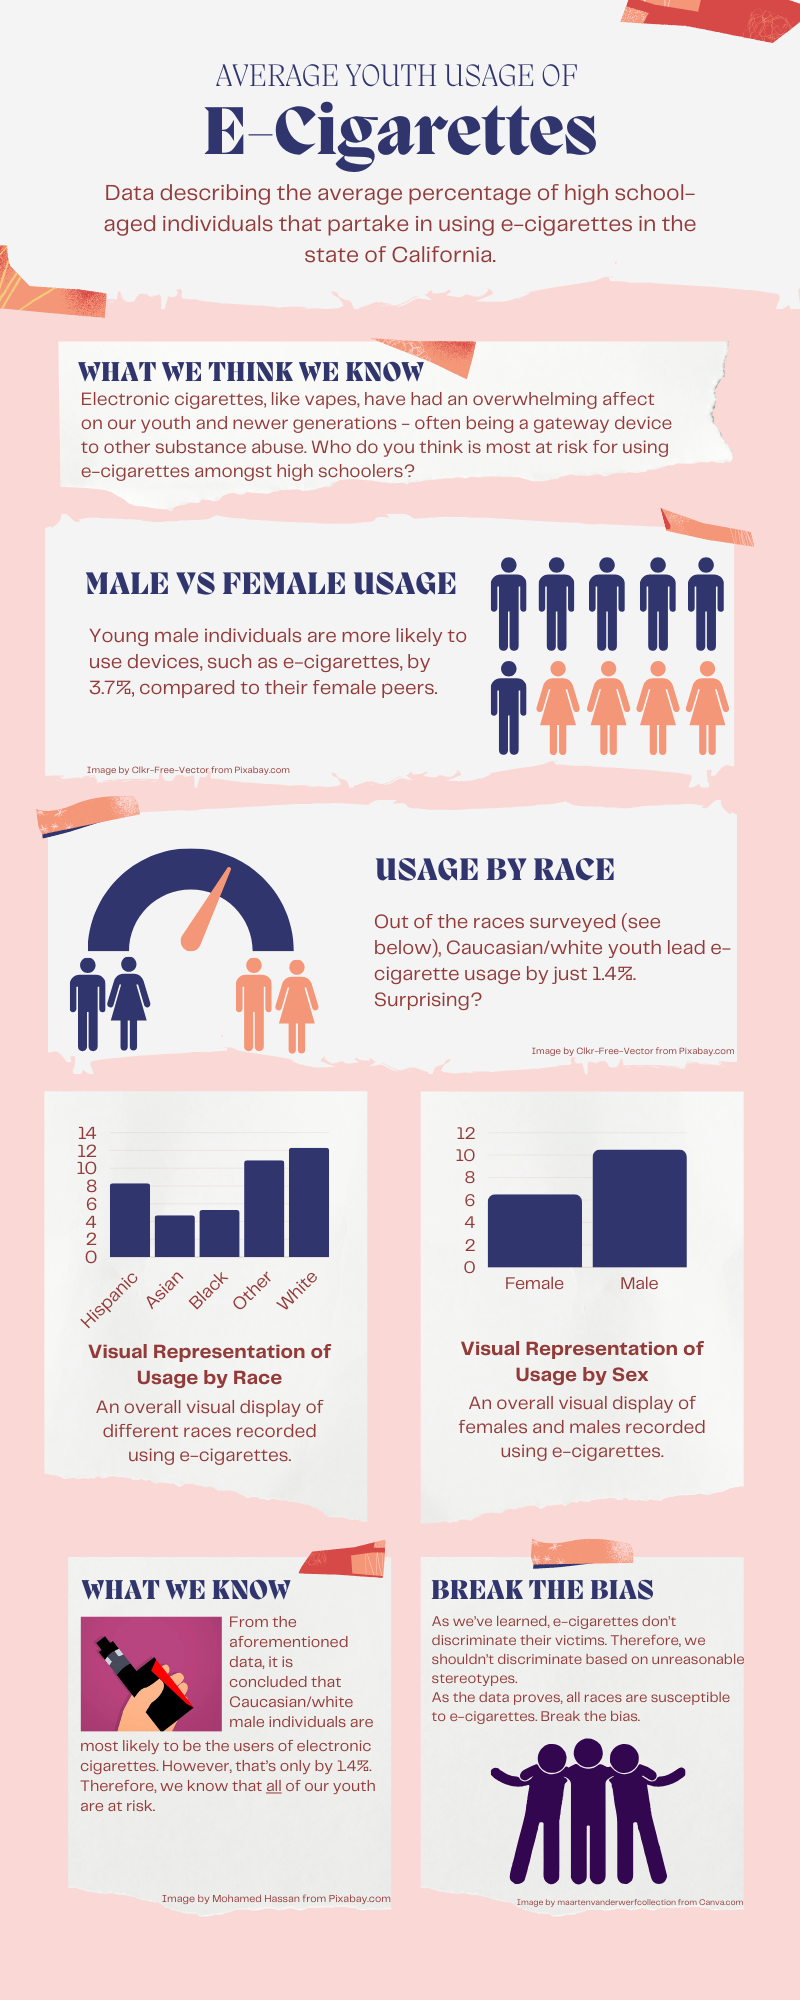
My data showcased ratios of electronic cigarette usage within high school-aged individuals located in California. The data I decided to isolate are race and sex based. I wished to have my data guide my story in the fact that we hold unreasonable stereotypes in many social situations. However, as a society, we hold “deviant” acts highly when considering these racial stereotypes. Therefore, I wanted my data and infographic to tell the story that, despite what we are told to believe by society, usage of e-cigarettes actually defy these ideals. In fact, it is white males that are most likely to partake in using electronic cigarettes. However, this is only by a small percentage. So, e-cigarettes (which are believed to be a gateway device to more dangerous substances) don’t discriminate, so neither should we when considering this. Thus, we need to break the bias.
To further inspect the data reflected in the infographic, you can visit the exact dataset I chose at Data.gov!
Why an Infographic?
Why I decided on an infographic to tell my story
I’ve made infographics for past classes, and I love the way they simply display data without missing any important aspects. Therefore, I felt that with my specific isolated components, that an infographic would perfectly display these elements, and leave myself room to pinpoint the story I wished to tell, and how the data related to the story.
How I Did It!
How I made the infographic and visual representations
I made the whole infographic using Canva.com, along with all of the data charts. However, although many of the images can be found directly from Canva’s website, many of the resources are actually rooted from Pixabay.com, and other free-source websites. Canva was very straight-forward to use, as many of the visuals were easy to drag, drop and move around. Additionally, I love using Canva for many projects, academically and otherwise, because Canva also produces all of the visual representations from the internet all in one place. However, as aforementioned, it’s always crucial to double-check where these images actually came from.
Attributions and Credits
Giving credit to all of the resources I used!




Image by maartenvanderwerfcollection from Canva.com
Data-Driven Story
My Audio Project: Field Hockey Injuries
The Podcast
Transcript
Sound of whistle blowing
Every game tells a story, not just through the goals scored but through the challenges players face on the field. Today, we dive into the data behind injuries in field hockey—a sport of speed, strategy, and skill.
Field Hockey game sounds
On the field, where injuries happen tells us a lot about the intensity and demands of the sport. In the women’s game, most injuries occur inside the circle—25 cases in our data. This area is where goals are scored and stakes are highest. Imagine the sound of sticks clashing and players diving to block shots.
More field hockey game sounds
For men, the risk rises even higher, with 95 injuries reported in the circle. The competitive pace and physicality of the game amplify the danger in these moments.
Sounds of footsteps running on turf
Injuries also spike near the 25-yard line. For men, 59 injuries were recorded here, compared to 17 for women. Midfield is quieter by comparison, with far fewer incidents. The game, it seems, demands the most in zones of intense offensive and defensive action.
Crowd Gasping
While these numbers highlight the risks, they also underline the resilience and strategy of the players. Every tackle, every sprint, every shot carries a calculated risk. Field hockey is not just a game; it’s a battle of endurance and courage.
Whistle Blows
The field is a stage where athletes push their limits, and every injury tells a story. This is the reality behind the game we love.
The Story
The data is based on where injuries occur the most on the field hockey field, both for men and women. The story outlines the intensity of the game in the sense that the areas of the field with the most action is where most injuries occur. The point of this story was to engage the audience with an emotional appeal as they feel the passion for the game, and understand the risks in the most intense areas.
Why a Podcast?
I chose a podcast so I could incorporate sound effects that reflect the intensity of the game. I wanted to challenge myself to be able to share a story through audio, which can be difficult to follow as a listener. The data for field hockey would be best reflected using sounds, or videos, however, I did not want to act out getting injured or risk anybody else.
The Process
I used Vocaroo to record my audios for the podcast. I recorded my script, then the sound effects. I then put all of the recordings into SoundTrap to edit. I pieced together the transcript, as well as the sound effects to give it a story tone.
Credit
I credit @nufhcats on Instagram for the sound effects of the team playing and cheering.
I credit Royalty Free Sounds for my other sound effects.
I credit Chat GPT for assistance on organizing my podcast.
Data-driven Storytelling
Information used
The information that I used was the information that we had to find last week for the project. The information that I found last week was the number of undergraduate students enrolled at UMW as of December 2023. I took the programs with the highest and lowest number of students enrolled. This information was obtained from the University of Mary Washington website.

Information presentation
I chose to do a short video. There are many occasions that when you are attempting to share data it can be BORING!! I know that I personally have had to sit through meetings or presentations that during that time all you could think is…this could have been an email. I chose an option that with images and “ear catching” background music would keep the attention of the viewer.
How it was made
Although I did not use video footage, I did use photographs, still images, and factual information sheet within the presentation to show the information I was trying to share. The video was made in Microsoft Clipchamp. I believe, for me at least, that is the easiest format to use to create and share your video creations.
Presentation
Credit for informatio used
Images of the University of Mary Washington
Cereal Data!
Do you have a favorite cereal? I don’t have cereal often but when I do it’s usually because I have a random weird craving to have it for dinner like my mom used to let me do occasionally; perhaps it’s a craving for that familiarity of a fond childhood memory. Either way, I know one thing about cereal: their nutrition facts are all over the place (maybe that’s just all processed and packaged American food? That’s for another blog post entirely). Anyways.
I Zeroed in on Fiber and Potassium
I found this dataset of 80 cereals, cleaned it up, and I took a look at it to see if there were any significant comparable numbers and trends. I looked at each aspect of the nutrition label including sugar, fiber, sodium, fat, calories, and vitamins, but what I found was that a strong positive correlation exists between fiber and potassium, indicating that cereals high in fiber are also likely to be high in potassium! I went further as to see which manufacturers cereals average the highest fiber and potassium content, and I found that it was Nabisco! Those are the people that make Oreo’s and Nilla Wafers (who knew they also made cereal? Not me). This was compared to Quaker Oats, Post, Kelloggs, and General Mills (I took out the American Home Food Products data).
The blue bars in my chart represent fiber content. I know my chart is sad (at best), but if you look closely (yikes), in the Nabisco section, you can actually see the blue bars compared to in the other manufacturer sections where it barely exists.
An Infographic?
I actually switched around what I was going to do at least four times. I had no idea how I was going to go about it and ultimately, a long vertical infographic popped into my head and it made sense to me. Now, I wrote the text first before editing the layout of the infographic and I fear it sounds very sales-y, commerciall-y, market-y, but that’s just what I’m used to! I tried, OKAY! I like to think of it as ~informative~. I figured there are a lot of people who don’t like to be told about what’s in the food they’re eating (trust me, I would know), and this is a playful, calm way to go about it. That’s another reason I just chose to identify and report on a trend rather than identify a trend and then use my media portion to be like, “Cereal has so much sugar! It’s gonna give you diabetes!” You know?
Canva A.K.A. my Bae
Canva is actually the love of my life and she executed my vision for this infographic perfectly. Included my chart, visuals of cereal bowls and other supporting icons, an icon with the correlation of the potassium and fiber link, and the Nabisco logo. I broke up the text into small, digestible chunks, getting straight to the point with each, but also making fun, engaging titles to grab attention (you have to be fun when the topic is cereal). I used Canva on my Chromebook!
Attribution
All of the icons are from within the Canva platform with the exception of the Nabisco logo which I got from a simple Google search and of course the chart I made on Microsoft Excel. Canva has so many cute icons. Don’t play with her! All of my nutrition based facts and tips are from the CDC.
In Another Life
In another life where I actually like looking at numbers and I desire to get better at making charts and stuff of the sort in Excel, I would have added a scatter plot highlighting the higher numbers in Nabisco cereals. I also would have made a chart where it just shows the average fiber and potassium content of each manufacturer instead of the content for multiple cereals, that way it’d be less cluttered. I think the use of small little bowl and spoon icons on a chart or scatter plot would be cute and simple too.

Now go, and eat thy cereal!
Final Project Idea

Mix of two?
For my final project, I want to create a subdomain for my cats. I would like to use option 2 to create a website to continue my cat’s Instagram page. This also could be option 3 because there isn’t specific project I want to do like a podcast or such. I am interested in expanding my page for the cats including photos, videos, articles, and updates, similar to a blog.
Project 9 Data-driven Storytelling
Data:
I used the dataset from data.org. Based on the preliminary findings from the pivot data project last week, I used time series data on percent of adults with less than high school diploma in 1970, 1980, 1990, 2000, 2008 to 2012 and 2018 to 2022. The trend showed that although percent of adult with less then high school diploma has declined from over 80% in 1970 to about 26% in 2022, it’s still higher than National and State averages and over 9 times of Falls Church city. With this information I wanted to find out how the county with the more adults without high school diploma will do relative to the county with the less adults without high school diploma in terms of employment, household income and poverty. I compared the time series data on unemployment rate from 2000 to 2022 for the Nation, Virginia, Buchanan County and Falls Church City, the median household income in 2021 as a percentage of Virginia’s total for Buchanan County and Falls Church City and percentage of population classified as living in poverty in 2021.
The dataset for the analyses is attached.
Media:
I chose to communicate the story of potential relationships between having a high school diploma and chances of poverty by using infographics. The reasons behind this choice are as follows: (i) I have already done previous projects using audio and video and wanted to learn how to show information in infographics. (ii) I realized that the 1-pager infographics will be more effective in communicating the story and (iii) I can use infographics to simplify complex data and concepts, and make them easy to understand at a glance (Geeks for Geeks, 2024) Sharing the 1-pager infographics story in pdf format with friends and colleagues for them to consider the value of at least high school diploma would be faster for downloading and reshare than audio and video format that may have larger file sizes.
The infographics is attached
Process:
I used Canva to create the infographic. Because this is my first time creating infographic, I used a template with font, color, style and format that I want and replaced the information on the template with the information on diploma and poverty. I downloaded the infographic in a pdf format.
Story from the Data-Diploma and Poverty:
Will having a high school diploma improve the chances of avoiding unemployment, increasing household income and reducing poverty? Analyses of the data on adults with high school diploma, unemployment, household income and poverty indicate that having at least high school diploma could help you reduce the chances of poverty.
Figure 1

Figure 1 shows that the percentage of adults without high school diploma in Buchanan County is above the National and State averages and on average about 9 times that of Falls Church City from 1970 to 2022.
Figure 2

Figure 2 shows that the rate of unemployment from 2000 to 2022 was higher in
Buchanan County with more adults without high school diploma.
Figure 3

Figure 3 shows that the median household income as percentage of the VA total in 2021 for Falls Church City with less adults without diploma is about 3x that of Buchanan County. In the infographic this chart is replaced with graphics that communicates the information better. This is one of the usefulness of infographics
Figure 4

Figure 4 shows that Buchanan County with more adults without high school diploma has over 5 times poverty rate in 2021 than Falls Church City.
There may be great benefits to earning a diploma
However, more analysis would be needed to model the relationship between having a diploma and chances of reducing poverty. In the infographic this chart is replaced with graphics that communicates the information better.
Sources:
1) Data on Adults with less than High School Diploma: USDA, Economic Research Service using data from U.S. Department of Commerce, Bureau of the Census, 1970, 1980, 1990, 2000 Censuses of Population, and 2008–12 and 2018–22 American Community Survey 5-year period county-level estimates. Data are as of June 20, 2024.
2) Data on Unemployment and Median Household Income: U.S. Department of Labor, Bureau of Labor Statistics, Local Area Unemployment Statistics (LAUS); median household income: U.S. Department of Commerce, Bureau of the Census, Small Area Income and Poverty Estimates (SAIPE) Program.
(3) Data on Poverty Rates: U.S. Department of Commerce, Bureau of the Census, Small Area Income and Poverty Estimates (SAIPE) Program.
(4) Geeks for Geeks (2024). What is an Infographic? 10 Jul, 2024. Geeks for Geeks
Data Storytelling

I downloaded my data from the USDA website. The story I found in my data was that the smaller the size of the fruit the higher the price per pound was.
I used Canva to make my infographic. I created a graph to represent the fruit size and price. This supports my story because you can visually see the difference in the price of the fruit based on the size of it. To make the infographic on Canva I had to search up images of all the fruit individually. Then I used one of my graphs from Excel to get the approximate locations of each fruit and then adjusted it so that you can clearly see what each fruit is.
I used graphic free to use on Canva to create this.
Final Project Idea
Video Series
For my final project, I am going to make a three-part video series about movies. I have not decided on the movies yet, but they will have a range from ones that I personally enjoy, or movies that have a deeper meaning or message that needs to be discussed. Movies and cinema has been something I have always enjoyed, and I can not wait to deep dive into some of my favorites for my final project!
Data Storytelling: GPA Average’s
The Story
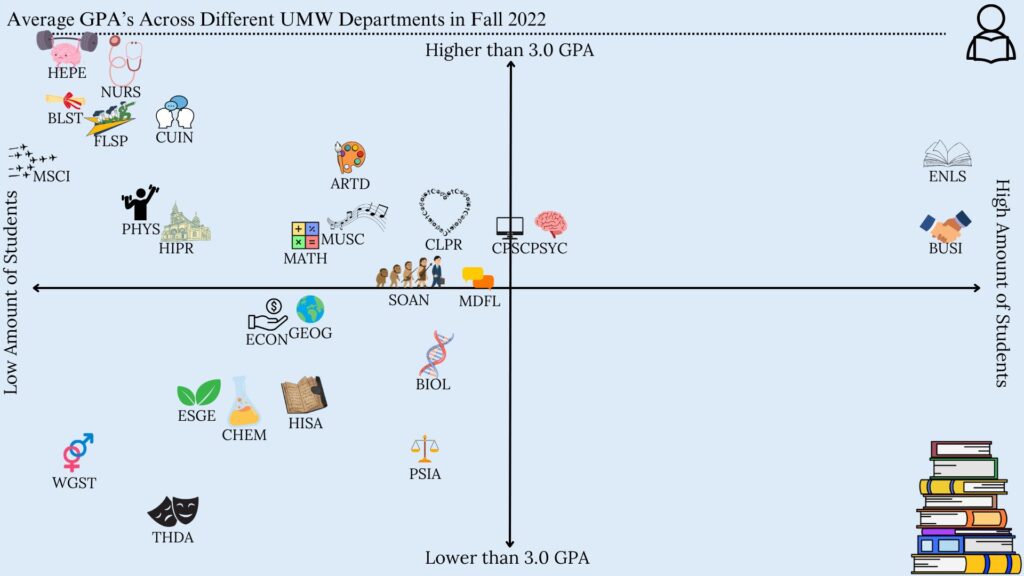
The main story that I could identify through the data is that departments that have a lower amount of people tend to have a higher average GPA in the Fall of 2022. These are the departments such as HEPE, NURS, and BLST. Although there were some outliers, such as ENLS and BUSI, which are possibly the biggest departments at UMW, they still have a higher GPA, but not as high as the departments mentioned before.
The Media
I chose to do an infographic chart that would show specifically where each department at UMW would land in terms of GPA average and the amount of students in each department. I did an x/y-axis sort of graph, where the more you went up the graph, the higher the gpa. As well as the more you went to the right of the graph, the more students that were in each department. This could also help in easily comparing different departments to each other.
The Process
I chose to use Canva in order to create my infographic. Canva is very easy to use, and has many free items to use that helped get my story across. I could easily edit the size, color, as well as the position of the data in the chart. It was also very easy to download as a JPEG in order to upload it to anywhere I want.
Credits
I found the data that I used on the UMW’s site for Institutional Analysis and Effectiveness and I used the 2022-2023 Grade Distribution Summary. I only used elements in Canva in order to create the infographic chart. Any extra clip-arts were also found on Canva, such as the student symbol in the corner and the stack of books.
