
For my final project I plan on building out my main domain to market myself to future employers and showcase projects and assignments that I have completed. I will add things that show my skills, my accomplishments, and anything else that would be appealing to a future employer.
Data Driven Story telling
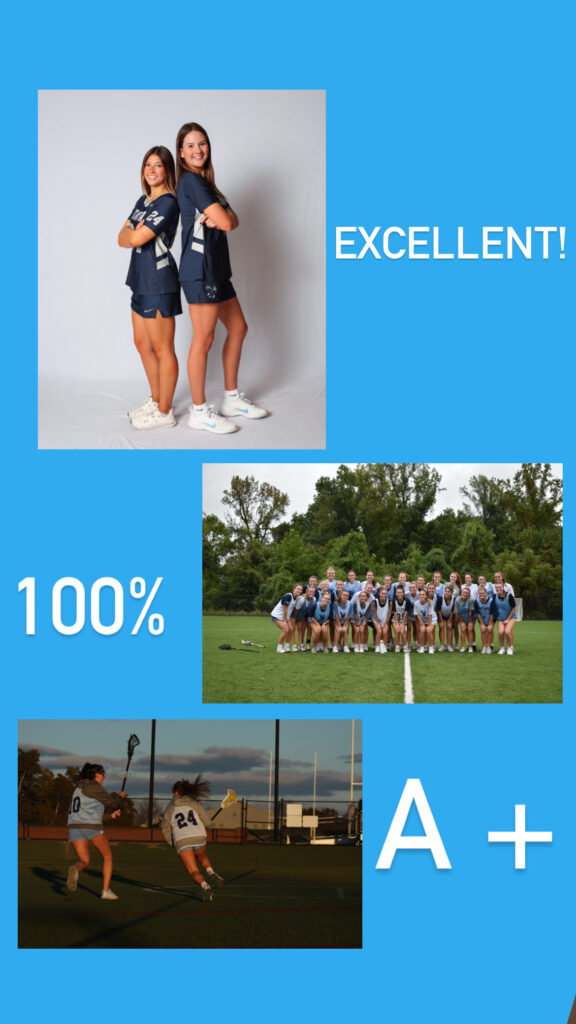
Audio Recording
Data
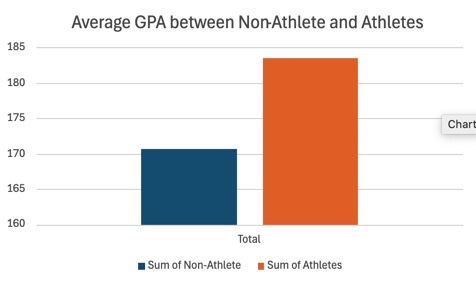
The data I used for this project was data comparing students who play sports in college verses students who don’t play sports grades. I got my data from StatCrunch. The data discussed how student athletes receive higher grades than students who don’t play sports.
Audio
I chose to create a short audio discussing this topic because I wanted to explain to listeners how the data was taken and what exactly it means. My audio supports my data because I discussed how students who play sports obtain a higher GPA, from a student-athlete perspective.
Equipment and Audio
I chose to use my computer audio recorder called “simple recorder” to record this project because it was simple and easy to use. To brainstorm the media I wanted in my audio I wrote down a checklist of what I needed to include.
Credit
Makenna Hadden
Final Project Idea
For my final project, I want to expand on my Coni101 podcast about student involvement in school. The first episode will be reused from the podcast module where I talk about how student involvement can impact your academics in a good way. After that, I’ll do two more episodes where I interview people who are involved in extracurriculars. One episode will be about balancing school, extracurriculars, and personal time. The other episode will be about students’ lifestyles before vs after getting involved in extracurriculars.
Final Project Idea
For my final project I want continue to discuss sports at UMW. I want to create a podcast and potentially interview sports players here at UMW. I would like to use my first audio from the audio assignment and then continue on with two other podcasts.
Data Project Checkpoint
Data
The data Set I used was comparing students who play sports verses students who don’t play sports GPAs. I used StatCrunch for my data.
The process
I used the data I found online to create an excel work book. I am very familiar with excel because I have used it several times before. I used the data to create a Pivot Table and used that to create the graph bellow. Here is my Excel Data.
Video Project
Topic
The topic I chose for my video was sports at UMW. I used YouTube to find a copyright free short clip of a field hockey game. For support for this topic, I used the UMW athletics website and the website Community College Daily for reasons why sports are important.
Credit for my Sources
Makenna Hadden
Vecteezy. Com (copyright free source)
The Recording Process
I chose to use my phone to record my videos. I used snap chat to create my cover photo. I used an app called video up! To edit my video and put all the clips together. Finally, I chose to upload my video to YouTube, so it is accessible to all.
Final Project Idea
For my final project, I would like to expand my main domain and include some of the work that best reflects my online identity and career aspirations. I would like to include my video and storytelling assignments, in addition to an infographic I made for another class. I would also like to include a few research papers from some of my psychology classes. The common themes for the included work will be literacy and community advocacy. Specifically, advocacy for women and underserved populations. Literacy and advocacy are two areas that I’ve been interested in since before college and areas that I have done a lot of volunteer work with. Also, I would like to find an internship in social services this summer and am considering a career in school counseling. I feel that the work that I plan to include will be a good representation of who I am to future employers.
Video Checkpoint
Shot List
| Done | Scene | Shot | Location | Shot Type | Scene Description | Camera Movement | Notes |
| FALSE | 1 | Graphic | Title Card | Make in Canva | |||
| FALSE | 2 | A | Kitchen | WS | Introduce Episode | Tripod | |
| FALSE | 3 | A | Kitchen | MS | Explain Ingredients | Tripod | |
| FALSE | 3 | B | Kitchen | CU | Show Ingredients | Pan across ingredients | |
| FALSE | 4 | A | Kitchen | MS | Explain equipment | Tripod | |
| FALSE | 4 | B | Kitchen | CU | Show equipment | Tilt up/down | |
| FALSE | 5 | A | Kitchen | WS | Brewing espresso | Tripod | |
| FALSE | 5 | B | Kitchen | MS | Brewing espresso | Tripod | |
| FALSE | 5 | C | Kitchen | CU | Brewing espresso | Tripod | |
| FALSE | 6 | A | Kitchen | MS | Frothing milk | Tripod | |
| FALSE | 6 | B | Kitchen | Graphic | steaming milk | find video online | |
| FALSE | 7 | A | Kitchen | WS | Pour milk into espresso | Tripod | |
| FALSE | 7 | B | Kitchen | MS | Combine milk and espresso | Tripod | |
| FALSE | 7 | C | Kitchen | CU | Finished latte | pan across mug | |
| FALSE | 8 | A | Kitchen | CU | adding flavored syrup | tripod | |
| FALSE | 9 | A | Kitchen | Graphic | recap of steps | Make in Canva | |
| FALSE | 10 | A | Kitchen | ms | concluding episode | Tripod | |
| FALSE | 13 | Graphic | Credits | ||||
Test Recording
Equipment
The equipment I will be using for this project is my phone and a tripod. I will use my iPhone to record and the tripod will stabilize my shots when I am talking.
Shooting
I plan to record myself making a latte and explaining how to make it. This will support my project because my podcast was of me explaining how to make the perfect latte, so the video will now just include visuals of how to do that.
Educating the Future of Education: A Look into the UMW Education Department in Light of the National Teacher’s Crisis
Interactive Infographic
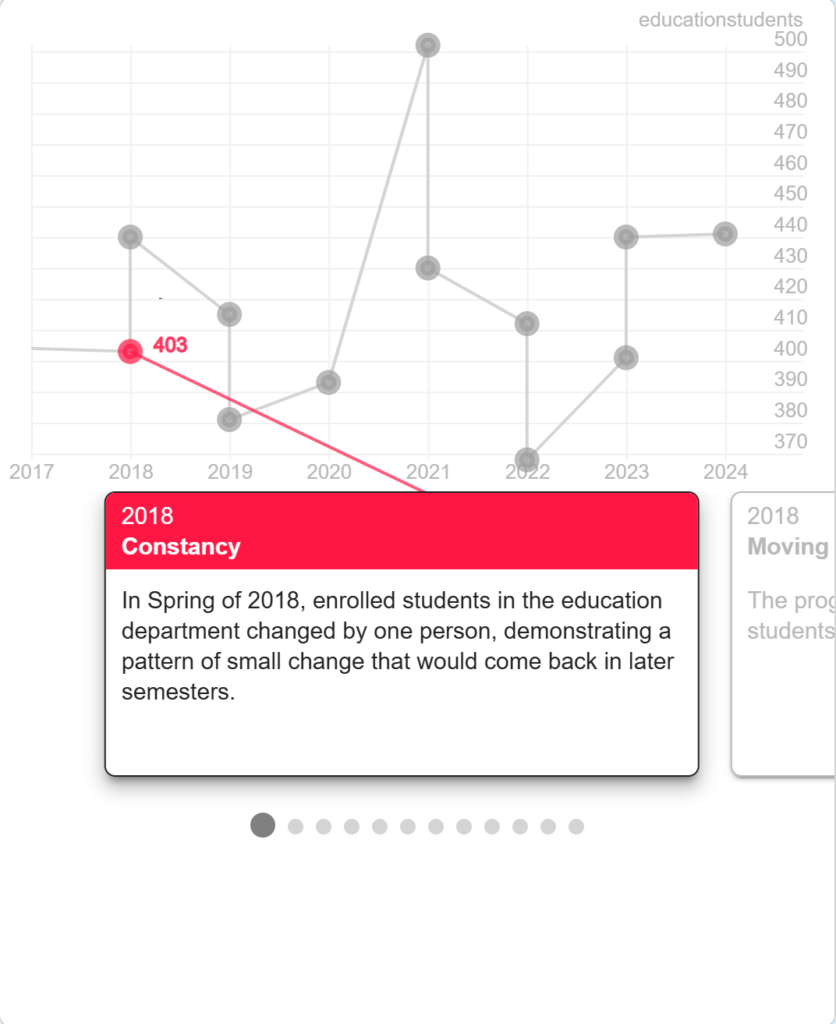
Visit this link for an interactive version of this graph.
Background
Diving Into the Data
In this project, I sought to investigate the enrollment of students in the UMW education department and examine if/how the number of students changed as the teachers shortage evolved in the US. By examining this data, taken from the annual Grade Distribution Report from UMW’s Institutional Analysis and Effectiveness department, I found a story surrounding curriculum education at UMW that was much different than I expected. Although the number of students enrolled in education classes was not the highest out of the departments at UMW, it was not the lowest either. In fact, the department did not only decrease in the number of students enrolled in education classes, as I had deduced due to the national teachers shortage, but had rather increased or remained stable as a whole. While COVID caused the loss of data for the Spring 2020 and smaller numbers in the Fall 2020 semester, the department was able to recover from COVID, initially growing in the number of students enrolled and eventually leveling off to stable enrollment numbers higher than the Fall 2017 students the data set began with. For more information, check out this Excel Sheet with the data on the number of education students each semester.
What Does This Mean?
While the nation faces a national teachers shortage, the number of students interested in entering the education field, while decreasing initially, has grown to stable, relatively high numbers of enrolled students. This proves that an interest in working in education field remains. Examining data sets and stories such as this one is so important because it allows federal, state, and local education officials to source the problems of the teachers shortage. This data set proves that there is not a decreasing interest in the education field, but rather other factors, such as poor working conditions and pay, that may be causing the teachers shortage. As the child of teachers, the importance of examining the causes and effects of the teachers shortage is important for keeping schools a safe space for learning for all children, with all the necessary resources for learning.
Software and Processes
To make this infographic, I used Excel to decipher the data and create a clean and effective table. This data was then imputed into a Google Sheets form that was used to create an infographic through Storyline’s system.
Credits and AI
AI was not used at all in the creation of this project. All media was created through the Excel or Storyline programs.
Final project idea
Build out main domain
For my final project, I want to build out my main domain. I used to be an artist, so I want my online identity to showcase that. I could add a few photos of my art I did and write about what materials I used and why I decided to create it. I had an art series I did on how time affects things so I could discuss that concept. I want my blog to be about my hobbies and what interests me, so I think that art would be the biggest factor and my biggest supply to show. For the project part, I could make another art piece, showcase it, and discuss how and why I created it.
