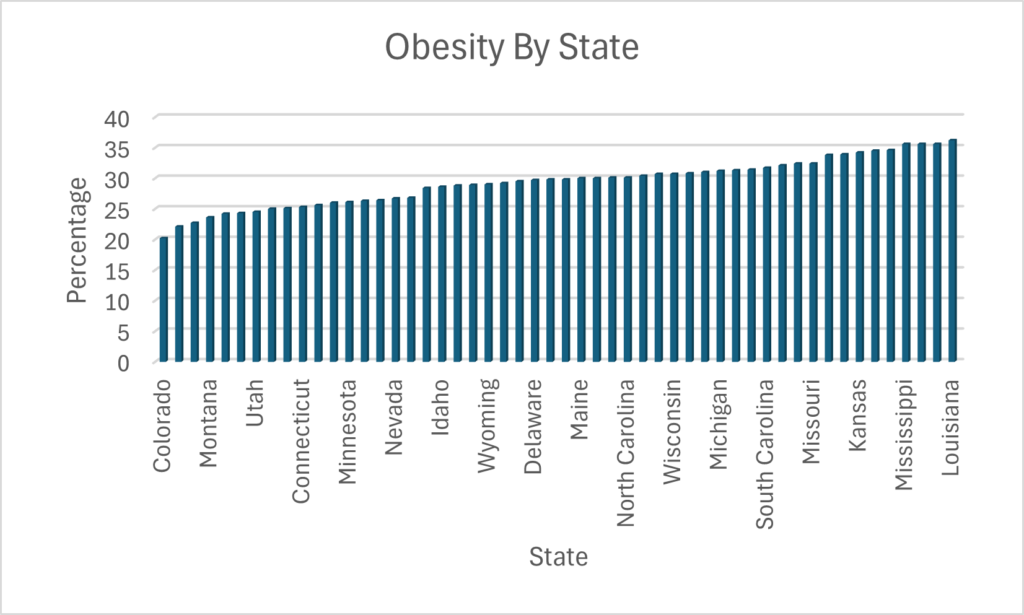
The data I analyzed from the National County Illinois GIS about Obesity Percentage By State showed that Colorado had the lowest obesity percentage, 20.2%, and Louisiana had the highest, 36.2%. The data was published in 2016 and updated in 2022. The top 10 states with the highest percentages are in the south. Apart from D.C. and Hawaii, all of the states with the lowest percentages are in the north or in the west.
Media
I decided to make an interactive map because it is a great visual for showing the states with the highest and lowest obesity percentages. It is a way for the users to interact with the media and see for themselves the trends of which parts of the country have higher obesity rates. It allows the user to click on different states to see their percentage and also see them in order from top 10 highest and lowest.
Process and Credits
I used StoryMap to create the map and used Canva to make the green and blue numbers for each state.
Hi everyone, welcome back to sports talk podcast. Today, we’re diving into the fascinating world of NFL injuries, based on our in-depth analysis of the 2015 season.
Let’s explore some surprising insights into how often players get injured and what factors might influence these rates.
First off, we tracked 1,794 NFL players throughout the season. Out of these, 688 players—about 38%—missed at least one game due to injury. 45% of players were healthy and available for all 16 games, and then 17% did not get injured but were not on a roster for every game.
Interestingly, running backs were found to be at the highest risk of injury. They have a 5.2% chance of getting injured each game, with an average injury length of 3.9 games missed.
In contrast, fullbacks had a surprisingly low injury rate, although this could be due to their limited sample size. There were only 6 reported injuries that resulted in them missing a game, however they are used much less than other positions so the sample size is too small to draw conclusions.
Quarterbacks and offensive linemen were among the least likely to get injured on a per-game basis. Quarterbacks had a 2.8% chance and offensive linemen had a 3.4% chance of getting injured each game. Yet, when looking at injuries per snap, these positions showed a strong correlation with injury rates similar to other positions. This could be due to their limited participation in special teams.
Now, you might think that the more a player is on the field, the higher their chance of getting injured. However, the analysis revealed that the percentage of snaps played doesn’t significantly predict injury likelihood. This finding suggests that factors like special teams play and practice injuries might contribute more to injury rates than actual game time.
Lastly, we discovered that the average injury causes a player to miss 3.1 games and the average chance of getting hurt per game was 4.1%.
That’s it for today’s episode! Stay tuned for more insights from the NFL as we continue to analyze the intricacies of professional football. Thanks for listening!
Story
I found a data set on NFL players injuries, which analyzed which positions were most likely to get hurt, and if minutes played directly reports to injuries. The data showed that running backs are most likely to get hurt, and quarterbacks and offensive linemen are least likely. It also showed that starters were not more likely to get hurt than backups.
Media
I chose to do a podcast because I was able to explain what the data showed and reasons for why that might be the case. It was not data that necessarily needed to be seen, so I could explain everything through a podcast and was able to add sound effects that related to football for better imagery.
Process
I recorded my podcast on Voice Memos on my iPhone, then uploaded the recording onto SoundTrap to edit.
Credits
The sound effects I used in the podcast were downloaded from Pixabay. I used Perplexity AI to assist in writing a script after I decided what datapoints I wanted to focus on.
I chose to base my project on this topic because I feel that it is an issue that many college students struggle with, especially those who are just transitioning from high school education. I struggle with studying myself, so creating this video was also beneficial for me. More information on this topic can be found here: Study Tips, Pomodoro Technique, and What is a mind map?. I was unable to use my audio project in this video because the footage I was able to get would have mostly been recorded by someone else, as the season has now ended, and what I was able to record didn’t mesh or tell a story.
Credits
The music used in this project was Hazy After Hours, created by Alejandro Magana, Mixkit. The mind map graphic was taken from Mural.co, author unknown. The resources I used for this project were from Rose Compass International and Todoist (linked above as Study Tips and Pomodoro Technique, respectively).
The process
I chose to use my iPhone 12 Pro to record, along with a tripod I already owned. Since most of my recording was done in one room, I thought that the basic materials would suffice, since I wasn’t planning on doing anything complicated. I used Soundtrap to edit the audio for my video, since I used it on the last project and felt very comfortable with it. I used iMovie to edit the video itself, since I own a Macbook and it is installed automatically. I’ve had some experience with iMovie in the past, so I also felt more comfortable using it than I would have with a different software. I chose to publish my video on Youtube because I’ve published videos for classes there in the past, so I was knowledgeable about the process and already had an account set up.
Education Interrupted: Drop in # of Students per Dept at UMW
Topic Selection
I picked this data set because I wanted to focus on the number of students in each department before and after COVID-19 drastically changed the school system. COVID-19 was in its prime in early 2020 and I believe it led to a decline in the number of students enrolling in college classes. To my surprise it was not as drastic of a change as I thought it would be. I found the data for number of students per dept on the Grade Distribution Report – Institutional Analysis and Effectiveness from the 19-20 and 20-21 reports.
Media Reflection
I chose to create an infographic so that I could portray pictures of college life before and after COVID-19. I feel like this really tells the story of the decline in students and also throws the numbers out there to really hit home.
Process
Canva made the process of creating the infographic pretty simple. Luckily, I have used Canva before, so I just had to do some playing around with it to create a template that looked decent. All of the little touches to the infographic and some of the background pictures came from searching through the provided images tab on Canva.
Credits
At first, I wanted to give video production another shot, and I used Copilot to give me some ideas, but I was not feeling creative enough for it. Here is the conversation:
Me: can you give me ideas on creating a short video incorporation visual imagery relevant to telling the story of how Covid-19 affected the number of college students continuing their education

Copilot: Creating a short video to tell the story of how COVID-19 affected college students' education can be powerful and impactful. Here are some ideas to help you get started:

### 1. **Introduction**
- **Opening Scene**: Start with a montage of bustling college campuses pre-pandemic, showing students attending classes, socializing, and participating in campus activities.
- **Title Screen**: Display the title of your video with a somber background music to set the tone.

### 2. **Impact of COVID-19**
- **Visuals**: Use news clips and headlines about the pandemic's onset and its impact on education.
- **Statistics**: Incorporate graphs and charts showing the decline in college enrollment and the shift to online learning.

### 3. **Student Experiences**
- **Interviews**: Feature short interviews with students discussing their personal experiences, challenges, and how the pandemic affected their education plans.
- **B-Roll Footage**: Show students attending virtual classes, studying at home, and dealing with the isolation.

### 4. **Challenges Faced**
- **Visuals**: Highlight key challenges such as financial difficulties, mental health issues, and lack of access to technology.
- **Quotes**: Use impactful quotes from students, educators, and experts to emphasize these challenges.

### 5. **Adaptation and Resilience**
- **Success Stories**: Share stories of students who overcame obstacles, adapted to new learning environments, and found innovative ways to continue their education.
- **Visuals**: Show students participating in virtual graduations, online study groups, and other creative solutions.

### 6. **Future Outlook**
- **Expert Opinions**: Include insights from educators and experts on the long-term effects of the pandemic on higher education.
- **Hopeful Imagery**: End with hopeful visuals of students returning to campus, engaging in hybrid learning, and looking forward to the future.

### 7. **Conclusion**
- **Call to Action**: Encourage viewers to support initiatives that help students continue their education.
- **Credits**: Roll credits with acknowledgments and any additional information.

### Additional Tips
- **Music**: Choose a soundtrack that matches the emotional tone of your video.
- **Transitions**: Use smooth transitions between scenes to maintain a cohesive flow.
- **Subtitles**: Add subtitles for accessibility and to ensure your message reaches a wider audience.

Would you like more detailed suggestions on any specific part of the video?

Me: could you make me an infographic on that topic

Copilot:
Me: what should the title of the project be

Copilot: Sure! Here are some more title options for your project:

1. **"Education Interrupted: The COVID-19 Impact on College Students"**
2. **"Pandemic and Progress: Navigating College During COVID-19"**
3. **"From Campus to Screen: How COVID-19 Changed College Education"**
4. **"Resilience in Education: College Students Amidst the Pandemic"**
5. **"Learning in Lockdown: The College Experience During COVID-19"**
6. **"Adapting to Change: College Life in the Age of COVID-19"**
7. **"The New Normal: College Education Post-COVID-19"**
8. **"Challenges and Triumphs: College Students' Journey Through the Pandemic"**
9. **"Virtual Classrooms: The Shift in College Education Due to COVID-19"**
10. **"Surviving and Thriving: College Students' Stories During the Pandemic"**

Do any of these titles resonate with you, or would you like more options?
Instead, copilot gave me some inspiration for an infographic and a title, and I took it and ran with it. Other credits for the UMW images in the infographic come from the departments’ Facebook accounts:
I chose to use my iPhone 12 Pro and a tripod I already own for this project, as they were the most accessible and of acceptable quality. Since I don’t plan to shoot in many different locations, I felt that this equipment would work best for me.
The vision
I plan to shoot footage of myself utilizing various study tips, including close-up video of the techniques being used. The purpose of my project is to provide a kind of how-to for studying, or to give ideas about different techniques to try. My visual content will achieve this purpose by demonstrating the techniques and showing examples.
Here is a link to my spreadsheet where I created the pivot tables and charts: Data Project Spreadsheet. Before I copied the pivot table and chart over to one spreadsheet this is where I organized the Fall 2020 data: Data Project Spreadsheet 2.
Data Trend Analysis
I picked this data set because I wanted to focus on the number of students in each department before and after COVID-19 drastically changed the school system. COVID-19 was in its prime in early 2020 and I believe it led to a decline in the number of students enrolling in college classes. To my surprise it was not as drastic of a change as I thought it would be. The departments that declined in students the most were: Historic Preservation, Music, Modern Language and Literature, Business, and Theatre and Dance. There were some departments that rose in students, but it only ranged from about 5-15. The departments like Music and Theatre and Dance are not surprising that they dropped students because it requires them to interact and be in person. When analyzing this data, I thought for sure that the sciences would be affected more because of the in-person lab classes. Although, I do believe that the school systems especially at the university level did a great job at adapting to the situation at hand to ensure that students could continue their education. Overall, there was a decline of 2,835 students between the Fall 2019 and Fall 2020 semesters.
How Did I Find and Organize This Data?
I worked with the Grade Distribution Report listed on UMWs website. I was able to download both the 19-20 and 20-21 school years reports as an excel sheet. I then formatted it into a table and analyzed the table to determine which information I wanted to focus on. I deleted some rows and the other sheets that I knew I would not be using. I then created a pivot table in a new worksheet, so that I could just focus on the rows for departments and number of students. When it listed departments it gave a row that is called blank, so I went back to my other sheet and deleted those rows that did not list a department and refreshed my pivot table. I then took the information from the pivot table and had Excel generate a chart for me. I did this on both school years reports and copy and pasted the pivot table and chart onto one sheet to consolidate it all and compare.
For my final project, I will be creating a new subdomain for a podcast series. Within this subdomain, I will create 3 episodes, which will all be accessible and include podcast transcripts.
The topic
I’m a really big fan of anything true crime, including documentaries, podcasts, and my all time favorite T.V. show, Criminal Minds. As such, I’m going to lean into this interest and make my podcast about various serial killers, talking about the history of their lives and actions, and I might even dive into the psychology behind their mindset.
The states with the lowest obesity percentage are primarily the mid west and northeast states. The top 11 states with the highest obesity percentage are in the south.
Process
I used Microsoft excel to format and analyze the data. I created a pivot table with the information I needed for the graph, which was state and percentage, and then sorted the data from lowest percentage to highest. I then created a graph from that table in order to see a trend.
For my data project I have decided to analyze the amount of students in each department at UMW in the Fall 2020 semester. Here is a link to where I found this data.
Based on the data I was able to find that in Fall of 2020 UMW had the most students on the psychology department and the least amount in the dance department.
I used Microsoft Excel to separate and analyze this data. I first created my pivot table and made the axis the courses and then made the value to be the number of students per department. I then took this table and put it is order from least amount of students to most amount of students.
For my final project I would like to create 2 more episodes of my podcast. I feel as though I can be more successful in this because I found it more engaging, compared to the other projects, to work with audio. I am passionate about my podcast topic and really wanted to talk more about it but was only allowed to for 2 whole minutes (so sad). But now I can!