For my final project, I want to build out my main domain. I used to be an artist, so I want my online identity to showcase that. I could add a few photos of my art I did and write about what materials I used and why I decided to create it. I had an art series I did on how time affects things so I could discuss that concept. I want my blog to be about my hobbies and what interests me, so I think that art would be the biggest factor and my biggest supply to show. For the project part, I could make another art piece, showcase it, and discuss how and why I created it.
Via Canva Via Google SheetsVia Google SheetsVia Google SheetsVia Google Sheets
Topic
You can find both data sets here. I used undergraduate fall 2019, and undergraduate fall 2020. I wanted to highlight the differences that COVID-19 had on the number of students and the total F percentage grade and compare the data between the two semesters. I found that fall of 2020 had almost three thousands less students compared to fall of 2019. I also found that the total F grade percentage from fall 2020 is almost three percent higher then the total of fall of 2019.
Media reflection
Instead of making a video or a podcast, I chose to make an infographic. For data sets, I felt this was the best option, as I didn’t know how to incorporate sounds or visual elements. An infographic was the best way for me to showcase my data trends.
Process
I chose to use Canva to make my infographic. I chose a premade infographic with an aesthetic I liked and customized it to fit my data report. I then used Google Sheets to make the graphs you see at the top of the post. I only used my computer to use this project.
Credit
For my pictures of graphs, I used Google Sheets to generate them. For my infographic, I used Canva. I did not use AI on this project.
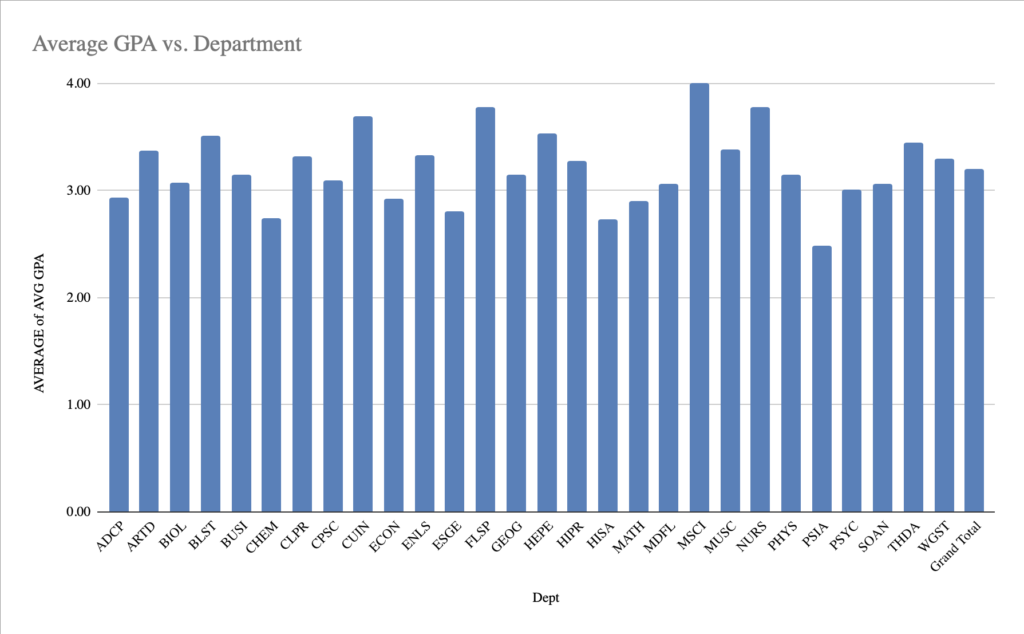
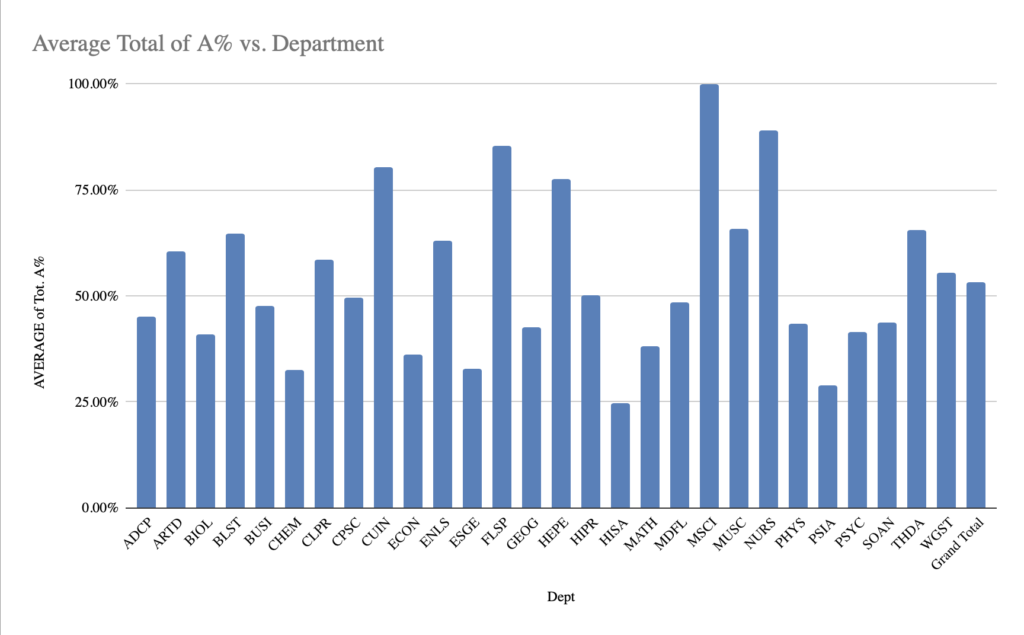
For my trend analysis, I decided to analyze the average percent of A’s in each department. First, I found the average GPA’s in each department, and from there, I found the average percent of A’s. From these charts, I found that the lower the GPA for a class, the lower the A% average. For example, the PSIA department, or Political Science and International Affairs, had only a 2.5 average GPA. And only 26% of the students that semester received an A.
Process explanation
I used Google Sheets to help identify the trend. I put the data into the table and saw the averages for the GPA as well as the A% averages. I wanted to know the correlation between the two so I made separate tables. I was able to put both into pivot charts to easily identify the correlation. A’s in classes significantly help raise a GPA, so that’s why I chose those two different sections of the data.
On YouTube, the video has captions, but I’m not sure if you can see the captions here.
Topic
I wanted to talk about ASMR because I really like it, and I have a lot to say on the matter. Autonomous sensory median response, or ASMR, are quiet sounds that produce a tingling sensation, like brushing your hair, that create a sense of tranquility. Psychology Today has a great article describing why ASMR is so popular and how it helps. Gazing at someone kindly, quiet sounds, and light touches are three major categories of ASMR. The most popular sound in ASMR is, not shocking, whispering. Not only is it a soothing sounds, but it also conveys the person doing the ASMR has a kind personality. ASMR University has an article that goes more in depth into the reason why ASMR and whispering is the way that it is.
Credits
Photos
Via Adobe ExpressVia Adobe Express
Music
Celtic Moon-Loop 1. Via Adobe Express.
ASMR Sounds
Tree branches breaking, snapping, snapping cracking 10. Via Adobe Express.
Crunching or cracking 02. Via Adobe Express.
Rocks knock against each other. Via Adobe Express.
Process
I recorded with my iPhone for the camera. I have a newer model, so I have good video quality, and I have the option to zoom in and out easily. The reason I chose to use my iPhone is because it was readily available and I didn’t have to rent anything. For the software, I chose to use Adobe express, which is a free video editing site. Adobe is a popular choice for editing, so I decided to try it out. It’s also free, so I thought it was the best choice. I uploaded my video to YouTube because I already had an account set up with no videos, so I thought this could be the first. I chose YouTube because I know how to upload videos easily, and it’s free to upload.