For my final project I made a portfolio with some projects I have completed that showcase skills I’ve learned and what I am capable of doing.
I included alternative text for all images, put headings on all pages and posts, added descriptive text with all links, and have high color contrast for all images and texts. The picture included was my own and I created everything included on the pages. The header and site logo I created on Canva. The information I included was all from projects that I completed, so it is my own work. I chose CC BY because I want others to be able to use my work and build off of it as long as they give credit to me. I did not get any help from AI on this assignment. When making my portfolio, I went through recent past projects and chose the ones I was most proud of to include. I added them to my site and added a page about myself.
The data I analyzed from the National County Illinois GIS about Obesity Percentage By State showed that Colorado had the lowest obesity percentage, 20.2%, and Louisiana had the highest, 36.2%. The data was published in 2016 and updated in 2022. The top 10 states with the highest percentages are in the south. Apart from D.C. and Hawaii, all of the states with the lowest percentages are in the north or in the west.
Media
I decided to make an interactive map because it is a great visual for showing the states with the highest and lowest obesity percentages. It is a way for the users to interact with the media and see for themselves the trends of which parts of the country have higher obesity rates. It allows the user to click on different states to see their percentage and also see them in order from top 10 highest and lowest.
Process and Credits
I used StoryMap to create the map and used Canva to make the green and blue numbers for each state.
Hi everyone, welcome back to sports talk podcast. Today, we’re diving into the fascinating world of NFL injuries, based on our in-depth analysis of the 2015 season.
Let’s explore some surprising insights into how often players get injured and what factors might influence these rates.
First off, we tracked 1,794 NFL players throughout the season. Out of these, 688 players—about 38%—missed at least one game due to injury. 45% of players were healthy and available for all 16 games, and then 17% did not get injured but were not on a roster for every game.
Interestingly, running backs were found to be at the highest risk of injury. They have a 5.2% chance of getting injured each game, with an average injury length of 3.9 games missed.
In contrast, fullbacks had a surprisingly low injury rate, although this could be due to their limited sample size. There were only 6 reported injuries that resulted in them missing a game, however they are used much less than other positions so the sample size is too small to draw conclusions.
Quarterbacks and offensive linemen were among the least likely to get injured on a per-game basis. Quarterbacks had a 2.8% chance and offensive linemen had a 3.4% chance of getting injured each game. Yet, when looking at injuries per snap, these positions showed a strong correlation with injury rates similar to other positions. This could be due to their limited participation in special teams.
Now, you might think that the more a player is on the field, the higher their chance of getting injured. However, the analysis revealed that the percentage of snaps played doesn’t significantly predict injury likelihood. This finding suggests that factors like special teams play and practice injuries might contribute more to injury rates than actual game time.
Lastly, we discovered that the average injury causes a player to miss 3.1 games and the average chance of getting hurt per game was 4.1%.
That’s it for today’s episode! Stay tuned for more insights from the NFL as we continue to analyze the intricacies of professional football. Thanks for listening!
Story
I found a data set on NFL players injuries, which analyzed which positions were most likely to get hurt, and if minutes played directly reports to injuries. The data showed that running backs are most likely to get hurt, and quarterbacks and offensive linemen are least likely. It also showed that starters were not more likely to get hurt than backups.
Media
I chose to do a podcast because I was able to explain what the data showed and reasons for why that might be the case. It was not data that necessarily needed to be seen, so I could explain everything through a podcast and was able to add sound effects that related to football for better imagery.
Process
I recorded my podcast on Voice Memos on my iPhone, then uploaded the recording onto SoundTrap to edit.
Credits
The sound effects I used in the podcast were downloaded from Pixabay. I used Perplexity AI to assist in writing a script after I decided what datapoints I wanted to focus on.
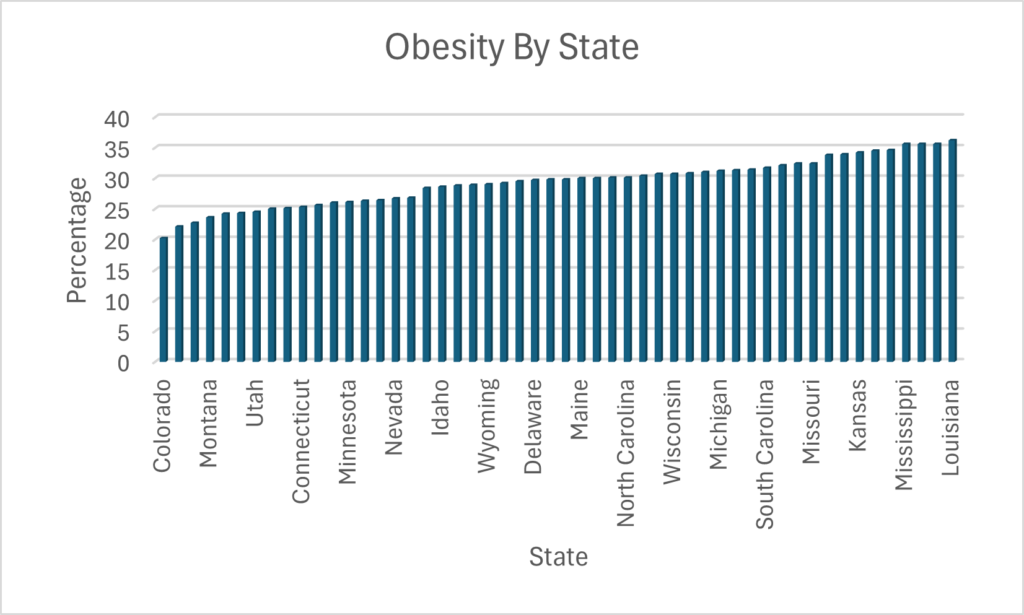
The states with the lowest obesity percentage are primarily the mid west and northeast states. The top 11 states with the highest obesity percentage are in the south.
Process
I used Microsoft excel to format and analyze the data. I created a pivot table with the information I needed for the graph, which was state and percentage, and then sorted the data from lowest percentage to highest. I then created a graph from that table in order to see a trend.
Image found on Pexels.com from Darina Belonogova. Graphics made on Canva.
The Process
To film my video, I just used my iPhone and a tripod. The video quality on my iPhone is good enough that I didn’t feel like I needed to use a nicer camera! I used iMovie to edit my video because I have experience editing on this app before, so I know how to use it and could do it on straight from my phone. I decided to upload this video to YouTube, because again, I have done this before and am familiar with the process.
For my final project I plan on building out my main domain to market myself to future employers and showcase projects and assignments that I have completed. I will add things that show my skills, my accomplishments, and anything else that would be appealing to a future employer.
The equipment I will be using for this project is my phone and a tripod. I will use my iPhone to record and the tripod will stabilize my shots when I am talking.
Shooting
I plan to record myself making a latte and explaining how to make it. This will support my project because my podcast was of me explaining how to make the perfect latte, so the video will now just include visuals of how to do that.