Final Project

Liv Loves Movies Podcast Website

Liv’s Loves Movies Podcast

Credits and Accuracy

I researched thoroughly about each movie that I talked about so that the information would be accurate, such as when the movie came out or who directed it. For any images or graphics, I used Canva in order to create them easy. I also have Canva Pro, so I had access to a lot of materials to make my graphics unique. I not only included my own voice in the audio, but I also found audio clips on Youtube, mostly from Movieclips, in order to get my message across better. I found them on the channels listed and linked below. Lastly, I used Pixabay to find background music that would pull the audio together, which is Peace In Every Note-chill background music by u_ew2iqff1co.

Accessibility

When making the podcast, I wanted to make sure that everyone had access to it. I put my podcast on Spotify, which is a widely-used music streaming service. On my website, I included the whole transcript so that people are able to read exactly what I am saying in the podcast. I also hyperlinked the episodes on the website so people could easily access them.

AI and Copyright

For AI, I used ChatGPT in order to help make a script for each episode. It was very helpful in providing ideas for clips I could use or what I should say for an intro or outro. I also used an AI software in order to create the transcript for the episodes. I chose the copyright license of CC BY-NC 4.0 because I want people to be inspired from it and maybe share their own ideas or theories of the movie I am talking about. Although, I do not want people to commercialize it as it is my own work.
Final Project Idea

Video Series

For my final project, I am going to make a three-part video series about movies. I have not decided on the movies yet, but they will have a range from ones that I personally enjoy, or movies that have a deeper meaning or message that needs to be discussed. Movies and cinema has been something I have always enjoyed, and I can not wait to deep dive into some of my favorites for my final project!

Data Storytelling: GPA Average’s

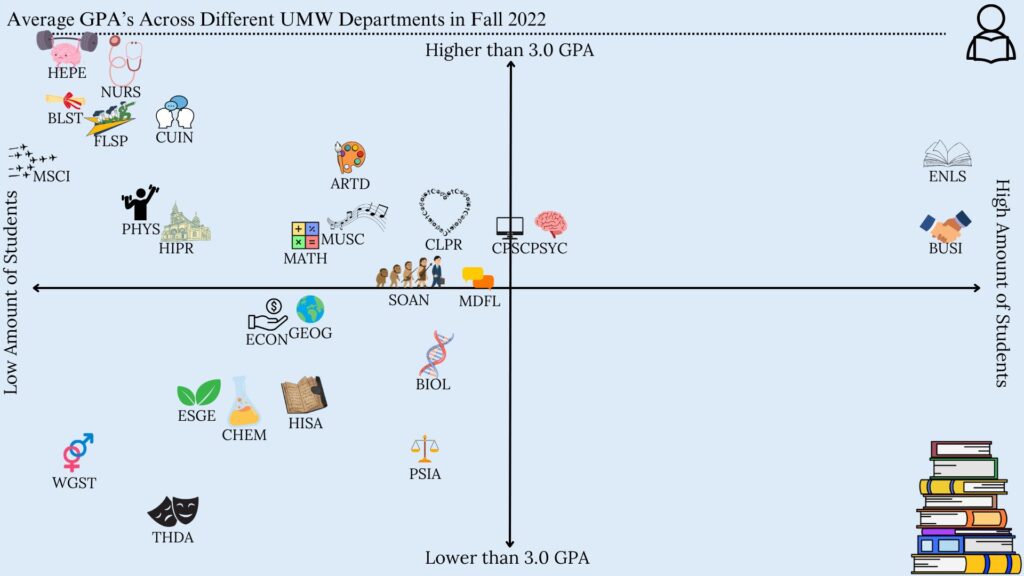
A graph comparing the GPA's averages as well as the amount of students that are in each department at the University of Mary Washington.

The Story

The main story that I could identify through the data is that departments that have a lower amount of people tend to have a higher average GPA in the Fall of 2022. These are the departments such as HEPE, NURS, and BLST. Although there were some outliers, such as ENLS and BUSI, which are possibly the biggest departments at UMW, they still have a higher GPA, but not as high as the departments mentioned before.

The Media

I chose to do an infographic chart that would show specifically where each department at UMW would land in terms of GPA average and the amount of students in each department. I did an x/y-axis sort of graph, where the more you went up the graph, the higher the gpa. As well as the more you went to the right of the graph, the more students that were in each department. This could also help in easily comparing different departments to each other. 

The Process

I chose to use Canva in order to create my infographic. Canva is very easy to use, and has many free items to use that helped get my story across. I could easily edit the size, color, as well as the position of the data in the chart. It was also very easy to download as a JPEG in order to upload it to anywhere I want.

Credits

I found the data that I used on the UMW’s site for Institutional Analysis and Effectiveness and I used the 2022-2023 Grade Distribution Summary. I only used elements in Canva in order to create the infographic chart. Any extra clip-arts were also found on Canva, such as the student symbol in the corner and the stack of books. 

css.php