Final Project – Gilmore gossip Podcast

Accessibility

For my final project I utilized all forms of accessibility necessary. I included alt text for all images posted on my site, I created transcripts for all audio/ podcast recordings, I utilized high contrast colors on my site, I used headers to organize content on my website, and I included descriptive link text for all links on my website.

Media/ Source Credit

At the end of each of my posts, I included a credit and attribution section where I listed who created and edited the podcast (me!), where my intro and outro music came from, any sources I may have used, where I got my images, and who created the TV series that I discuss within my podcast. I also provided a link to each to ensure full credit is given. Also, I included captions underneath images that state what website the image was taken from.

Information Accuracy

My podcast was mostly based on my opinion, but I did utilize some blog and fandom sites that helped to organize my thoughts and ensure that I was accurately relaying information from the show.

Copyright License

I chose CC BY-ND 4.0 for my license. This is the same license I chose for my course subdomain. This license states that anyone can redistribute my work, so long as it is unchanged and I am given full credit. I chose this because I think it’s important to allow individuals to have access to digital work, but I wanted to ensure that credit was given where credit is due and my name is associated with my thoughts and my thoughts only.

AI Help

I did not use AI for anything in this project.

Media Making Process

For this project, I used Vectr and the Cricut app to create my favicon and header for my website. I struggled with finding the right shape on Vectr, so I utilized the free shapes on Cricut to make my header and then inputted it into Vectr to alter the size for my header and favicon. I knew ahead of time what I wanted my favicon and header to be so this process was pretty quick and easy. The longest part of the process was creating my site. It was a lot of trial and error to ensure my site looked how I wanted it to. Once I had the site complete, I created my podcast using the voice memo app on Iphone and wired Apple headphones. I then downloaded the audio on my laptop and edited it using Soundtrap. I found the intro/outro music on Envato, which took a long time to find something I liked and that matched the vibe of my podcast.

Project Site

https://podcast.amkincaid.net/blog

Final Project Proposal

Idea

For my final project, I was thinking of doing another podcast. I really enjoyed creating the first one and I feel as if I could create a successful series. I will create a subdomain on my site which will house the series. I plan to create a new series, as opposed to continuing my previous podcast. The new podcast series will be about the show ‘Gilmore Girls.’ I feel that I could easily create at least three episodes critiquing the show.

Data-Driven Storytelling

Media Project

Adult Depression Rate Infographic

Data

Clean Data Set

Original Data Set

The Story

Overall, the data shows that depression rate is pretty consistent across races. On average, individuals of ‘other’ ethnicities and races have higher rates of depression. White individuals have on average, the second highest depression rates, followed by black, hispanic, and then asian/ pacific islanders. Another interesting find is that there was, on average, a slight increase in depression rates across all races in 2017. Oppositely 2012 had the lowest average depression rates across all races. As a psychology major, it is not uncommon to learn about the unequal availability of treatment. I feel that maybe the discrepancy between races could potentially be attributed to that. Because white individuals are of the majority, they have more access and better treatment than those of a minority group, thus possibly accounting for the much higher diagnoses.

Why I chose this Media & How it Supports the Story in the Data

I chose this infographic because I like that it allows you to see how the races stack up together within the same year. I find the discrepancy between races so interesting and I feel that this infographic allows my readers to interact with each data point individually. In doing so, they are more able to get a sense of how depression rates stay consistent per race over time, but how the individual races vary. I think that being able to see each year in its own section, really shows how big of a difference there is in diagnoses of depression across race.

Process

I honestly really struggled creating this media. Getting a hang of Storyline was the most difficult. Figuring out how exactly my data would be presented and what I wanted shown were the first step in the process. Once I figured that out, I played around with Storyline to show my data in the best way possible. The worst part of the process was getting it embedded to this post. For some reason, I struggled tremendously and could not get it to embed, which I think is because Storyline is not an accepted platform for embedding on WordPress.

Credits & Attribution

Data retrieved from Data.gov, adult depression (LGHC indicator) dataset. Published by California Department of Public Health. https://catalog.data.gov/dataset/adult-depression-lghc-indicator-627e3.

Graphic created by Alexa Kincaid via Storyline.

Data Project Checkpoint

Spreadsheet

Chart

Screenshot of chart depicting tobacco use depending on race.

Overall Dataset

National Adult Tobacco Survey

Trend

The overall trend that is visible in this data set is that cigarette use is the most common form of tobacco use across all races. Also, it is evident that all forms of tobacco use are most common among white people.

Process

The process I used was pretty simple. I first downloaded the data set from data.gov as an Excel file. I then cleaned my data by removing empty datapoints and irrelevant information to the point I was trying to prove. I had some previous experience using Excel, so I didn’t struggle with the overall cleaning process, but watched the informational video from Canva to show exactly what should be kept/ removed. Trying to figure out the point I wanted to make was probably the most time consuming part of this project. The overall NATS shows race, education level, gender, etc. along with tobacco use, so there were many options for what I could’ve chosen. After finally deciding my point, I then went through each chart to decide which showed this relationship the clearest.

There’s More to Life than Sports – Video Project

My Video

Topic

The topic I chose focuses on the benefits of watching sports as a family. Coming from a very sports-invested family, I can understand how we’ve been brought closer because of this. Although I don’t really enjoy sports themselves, my family gathers together every Sunday to watch football, thus ensuring that we have bonding time, despite not all living in the same house. Two sources I used to gather information are Meaningfulness of Watching Sports as a Family and Benefits of Watching Sports with Family.

Process

I used my IPhone to record all of the scenes, as well as a stabilizer for some of the shots. In order to edit the video, I used IMovie, as it was the most accessible to me and I have used it previously. I uploaded my video to YouTube, as it was the site I was most familiar with.

Credits and Attribution

Video created and edited by Alexa Kincaid via IMovie.

‘Actors’ shown: Alexa Kincaid, Andrew Kincaid, Aaron Kincaid, & Violet Kincaid.

Title and credit graphics created by Alexa Kincaid via Canva.

Sport fans packing a stadium for a game of football is from Anthony Z. Royster. Downloaded via Pexels.

A man holding a clipboard is from Cottonbro Studios. Downloaded via Pexels.

Group of boys plays soccer in a soccer field is from Kelly. Downloaded via Pexels.

Images are from Washington Commanders versus Tampa Bay Buccaneers game, November 14, 2021. Taken by Alexa Kincaid.

Podcast created and edited by Alexa Kincaid.

Intro is by INPLUSMUSIC. Downloaded via Envato.

Family Group Joke Laughter is by FxProSound. Downloaded via Envato.

Commentary is by Joe Davis from Dodgers versus Mets game, October 16, 2024.

Crowd Noise is from Dodgers versus Mets game, October 16, 2024.

Video Project

My Shot List

Color coded shot list depicting scene descriptions.

Test Recording

Most of my scenes will take place in my living room with similar lighting.

Equipment

What?

I plan to use my IPhone as the primary recording device. I don’t have a tripod, so I plan on using alternative methods for stabilizing the shot. I will most likely use a stack of textbooks and some sort of phone stand to stabilize the camera for recording.

Why?

I am using this equipment because it is the most readily available to me. As a commuter, using things I have at home make it so that I don’t have to make a special trip to campus to acquire other equipment.

Planning to Shoot

What?

I plan on focusing my scenes around the topics discussed in my podcast. It will mostly include clips of my family sitting together, talking and laughing. Also, it will include scenes of my brothers and dad playing football in the front yard, which is another specific instance I talked about in my podcast. Another scene that will be included is my mom cooking ‘football food’ for the family, which is a special tradition of ours. Lastly, some scenes will be shot at the park, showing people interacting with their friends and family.

Why?

I plan to include this material because it is specific to my podcast. My podcast includes a lot of personal anecdotes regarding my topic and I want to ensure that this is reflected in my video.

My Podcast – ‘There’s More to Life than Sports’

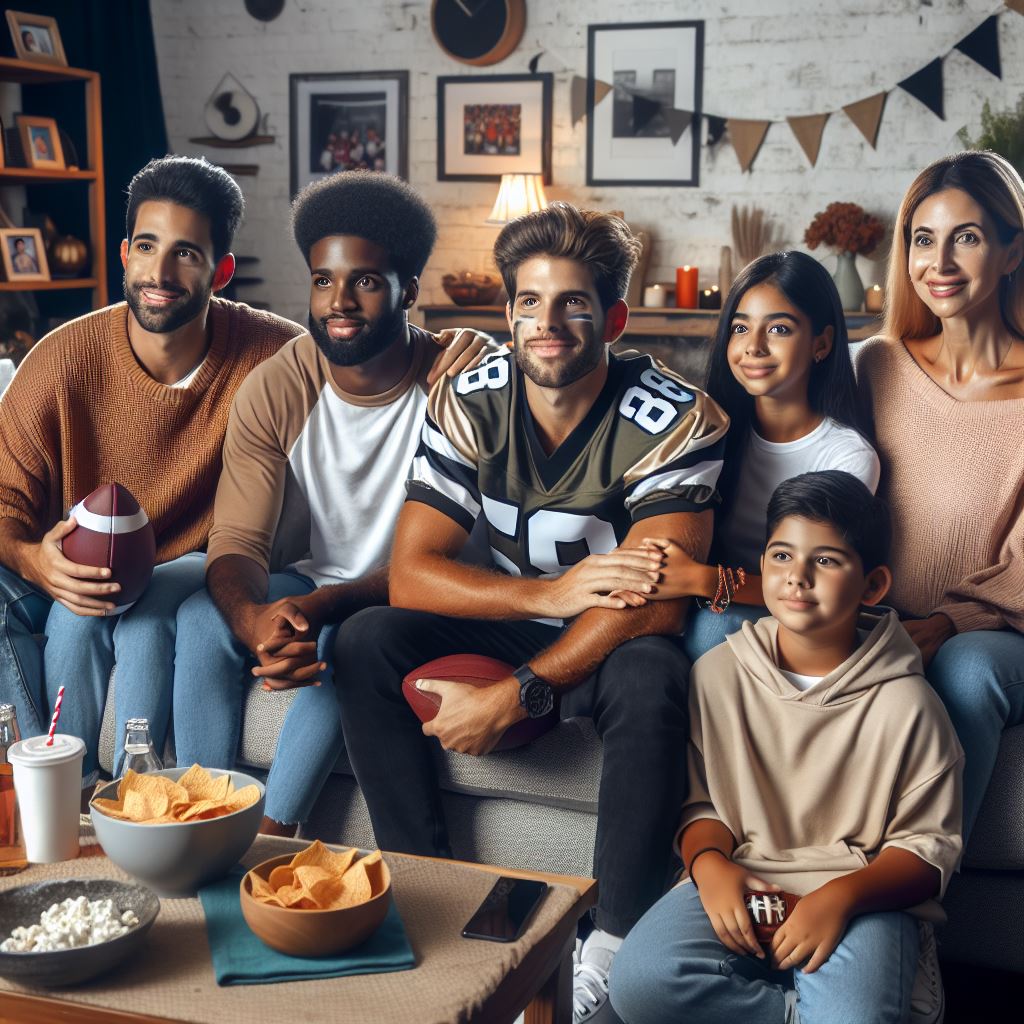
Family sitting together on the couch in sports jerseys and eating snacks, while watching television.
Image generated by Microsoft Copilot.

Transcript

This is Alexa and today I’m going to share why I think that sports are a crucial bonding activity for families. I’m sure most people have heard the phrase, ‘there’s more to life than sports,’ and I completely agree. There is more to life than sports, but they provide a way for us to appreciate the most important thing: our families. One of the most evident benefits of watching sports together is that it sets aside a specific time for families to gather together and relax. No matter the sport, as a family gathers together around the TV, they’re talking and laughing and spending important quality time together. From as early as I can remember, my family has sat together and watched football on Sundays. Even though I don’t necessarily enjoy the sport itself, I always look forward to this time together. Football Sundays are a big deal in my house, and they’re a tradition I plan to continue with my own family one day. Even as a kid, sports are an important part of your life. There are so many studies that show that sports are important not only for a child’s physical health, but also their mental well-being. This can also be the case with watching sports. Children can watch sports with their parents and learn the rules and the intricacies of the game. As I mentioned earlier, I was never a big sports fan; I didn’t and still don’t really enjoy playing sports, but while watching sports with my dad and my brothers, I learned a lot about competition and sportsmanship. Growing up, the boys’ love for sports extended outside of the TV as well. On countless Sundays there’d be family football games in the front yard, where my brothers attempted to teach me specific routes. Learning about sports has led me to have a healthy amount of competitiveness and has taught me a lot about the world. And lastly, the memories that a family makes while watching sports are immeasurable. From seeing your favorite team win the Super Bowl to attempting a new recipe for your family to try; these are the stories that are going to be passed down for generations to come. For my dad’s birthday a couple years ago, my brothers and I took him to a Redskins game, which was my first football game ever, and one of my favorite memories. So long story short, grab your family, pick a sport, and enjoy the game, because while you’re rooting for your favorite team, you’re learning that there’s more to life than sports.

Production

Equipment

To record this podcast, I used my phone and my wired Apple headphones. I also then used my laptop to edit the recordings.

Software

I used the Voice Memo application on my phone for the recordings themselves. I then uploaded them to my laptop and edited the recordings using SoundTrap. For the intro/ outro music, as well as one of the sound effects, I used Envato.

AI Help

I used Microsoft Copilot to help me create the general outline for the assignment, to which I then created the script and added my own personal anecdotes. Also, I used Microsoft Copilot to create the image for this post.

Credit & Attributions

Podcast created and edited by Alexa Kincaid.

Intro is by INPLUSMUSIC. Downloaded via Envato.

Family Group Joke Laughter is by FxProSound. Downloaded via Envato.

Commentary is by Joe Davis from Dodgers versus Mets game, October 16, 2024.

Crowd Noise is from Dodgers versus Mets game, October 16, 2024.

Image generated by Microsoft Copilot.

This topic was chosen based on personal experience, but additional information was provided by Meaningfulness of Watching Sports as a Family and Benefits of Watching Sports with Family.

css.php